How do you use the MACD indicator in crypto?
MACD or the moving average convergence divergence indicator denotes a momentum metric oscillator for traders who abide by a trend strategy.
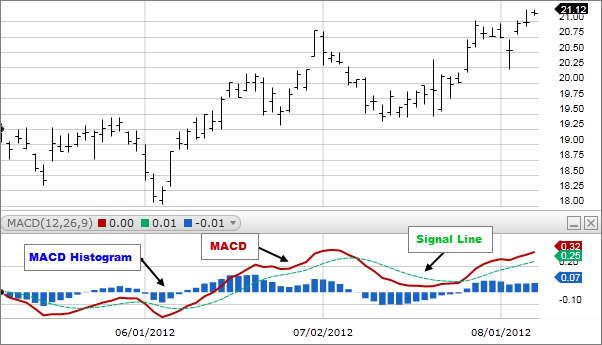
The metric appears on trading view as two lines, the MACD line and the signal line. You interpret a bullish trend whenever the MACD line crosses the signal line from below. Conversely, you interpret a bearish signal when the MACD line crosses the signal line from above.
To arrive at the MACD line, analysts subtract the 26-day exponential moving average from the 12-day exponential moving average (EMA). On the other hand, the signal line is a 9-day exponential moving average line. The majority of technical indicators offer traders one-sided information on previous price data. For the MACD, versatility is an inbuilt component. The metric acts as a 2-in-1 technical indicator for gauging trend direction as well as the strength of the trend. This occurs simultaneously.
In this post, we will dig into the MACD indicator and provide some details on how to use the moving average convergence divergence in trading digital assets such as bitcoin. The MACD is a good indicator for identifying potential buy/sell signals. Gerald Appel invented the signal in 1979 for helping traders calculate the strength, direction, momentum and length of an investment asset.
Understanding the MACD in detail
We mentioned that the MACD indicates a positive value whenever the 12-period exponential moving average lies above the 26-period EMA. Tradingview displays the 12-period EMA as a red line and the 26-period EMA as a blue line. A negative value takes place when the 12-period EMA lies below the 26-period EMA.
The distance between the MACD line and its baselines is an indicator of the distance between the EMAs. If the distance stretches, it means the EMAs are growing.
Usually, the trading view displays the MACD with a histogram. When the MACD lies above the signal line, the histogram lies above the baseline of the MACD. The baseline is also called the zero line.
When the MACD falls below the signal line, the histogram will lie beneath the baseline of the MACD. Analysts utilize the histogram for measuring when bullish/bearish momentum is high – readings are denoted in terms of oversold and overbought. Unlike the stochastic and RSI oscillators, the MACD line and signal line have no particular boundaries on a price chart. The histogram overlays the two MAs so as to complete the technical indicator.
The MACD belongs to the oscillator family of indicators. This indicator has the following specific uses :
- Evaluate the current price trend direction (whether bearish or bullish) and make a prediction on the direction the price is likely to take. This prediction is based on the association between the 12-period and the 26-period EMA. Therefore to understand how to use and work with the MACD, it’s crucial to understand moving averages. Moving averages are represented by a line graph on the price chart and indicate the average value of price data that an asset has touched over a given period of time.
- Determining the rate of change of cryptocurrency price fluctuations, talk of speed, strength and momentum of the trend. Retail investors implement the MACD to point out the strengths and weaknesses of a given cryptocurrency price trend.
Moving Averages
There are two types of moving averages: Simple Moving Averages (SMA) and Exponential Moving Averages (EMA). SMAs process all input price data equally, while EMAs place more weight on the most recent price data. However, the MACD is reliant on specific data that will help make relevant informed decisions when either buying or selling a crypto asset. This makes the MACD not only versatile but an easy tool for newbie traders to gauge market trends. Nonetheless, it is crucial to remind you to never make a trading decision based on the signal of one indicator. The MACD works very well in crypto and blends easily when implemented alongside the Relative Strength Index (RSI) and the Stochastic Indicator.
The MACD and the Relative Strength Index (RSI)
The Relative Strength Index determines whether an asset’s market is either overbought or oversold based on recent price levels. Just like the MACD, the RSI is an oscillator. However, the metric averages percentage price gains and price losses over a particular time frame. The RSI has the default time period set at 14 periods, and the values range from 0 to 100. When the RSI reading is above 70, the asset is trading in overbought conditions. Conversely, an RSI reading below 30 means the asset is trading in the oversold region. Both reading signal the potential of either a bottom or top formation. Unlike the RSI, the MACD lacks solid overbought and oversold conditions. Hence, when both indicators are combined, the results are complementary.
How the MACD Works
In order to understand how to use a MACD indicator, it’s important to understand its particulars on a graph. The MACD indicator is comprised of three key components:
- The MACD Line — the fastest moving average (short-term EMA)
- The MACD indicator formula is calculated by extracting a long-term, 26-day exponential moving average (EMA) from a short-term, 12-day EMA. It is usually coloured blue.
MACD Line = (12-day EMA minus 26-day EMA)The Signal Line — the slowest moving average (long-term EMA) - This is a 9-day line designed to show the turns of the price action, usually painted in red.
Signal Line = 9-day EMA of MACD LineThe MACD Histogram — fluctuates above and below a zero line, which helps to identify bullish and bearish momentum readings
The histogram is the difference between the first two elements (MACD line minus signal line). When MACD is above the signal line, the histogram is positive, and vice versa.
Thus, in order to read the signal correctly, one should check the following:
- When MACD is positive and the histogram is increasing as well, this serves as a sign of increasing momentum. The price tends to grow in this case, which can be interpreted as a “buy” signal.
- Alternatively, when MACD is decreasing together with the histogram value, it signifies that the price is most likely dropping and the asset should be sold.
In the next section, we will provide a more detailed explanation of how to read the MACD signals.
Interpreting MACD Signals
The MACD can help traders find three major types of signals:
- Signal line crossovers,
- Zero-line crossovers; and
- Divergence.
Let’s take a closer look at how you can spot potential buy and sell MACD signals.
1.Signal Line Crossover
This is the most basic signal that you can take advantage of. As stated above, the signal line shows the moving average (MA) of the MACD line. This is why it always lags behind. The obvious crossovers of these two lines signify potentially strong movements. The position of these lines shows whether a crossover is bullish or bearish:
Bullish crossover happens when the short-term EMA crosses above the long-term EMA.
Bearish crossover happens when the short-term EMA crosses below the long-term EMA.
2. Zero Line Crossover
To strengthen the signal further, look out for the general trend. If it corresponds with the crossover, the reliability of this signal will be higher.
This signal is similar to the previous one. The difference is that the MACD line crosses the zero level, instead of the signal line. When it turns positive, it signifies a bullish trend. And vice versa: when crossing the zero line in the downward direction and becoming negative, MACD points to a bearish trend.
Note: The further away from the zero line, the stronger the trend becomes.
What is MACD Divergence?
The divergence signal happens when the cryptocurrency price is moving in one direction, but the MACD indicator is moving in the opposite direction. The MACD divergence warns of an imminent trend reversal or a potential rally or decline in the cryptocurrency price.
When trading cryptocurrencies, we can distinguish two types of divergences:
- MACD bullish divergence — this happens when the cryptocurrency price makes a lower low, but at the same time, the MACD indicator fails to confirm the price and instead makes a higher low. This shows that the downtrend is losing momentum and a price rally may be right around the corner. When the MACD bullish divergence develops at the end of a downtrend, it forms an ideal reversal buy signal.
- MACD bearish divergence — this happens when the cryptocurrency price makes a higher high, but at the same time, the MACD indicator fails to confirm the price and instead makes a lower high. This shows that the uptrend is losing momentum and a decline in the cryptocurrency price may be right around the corner. When the MACD bearish divergence develops at the end of an uptrend, it forms an ideal reversal sell signal.
If the long-term trend is bullish, the MACD’s bullish divergences may also be a good sign, as they point to a potential trend reversal. However, in such a situation this signal is not so strong and should always be considered in combination with other factors, and vice versa.
Rapid Rises or Falls
One more signal that you can take advantage of, with the help of the MACD indicator, is how fast the MACD lines rise or fall. This happens when the short-term EMA rises or falls faster than the long-term EMA. On the price chart, this can easily be recognized by measuring the distance between the two MACD moving averages. This signifies that the asset is oversold or overbought and that its price is soon going to return to its normal state.
Note: The bigger the space between two MACD moving averages, the more oversold or overbought a cryptocurrency is.
MACD Settings and Setup
The most popular set of parameters used for setting up the MACD indicator is as follows:
- Fast: 12
- Slow: 26
- Signal EMA: 9
If you use MACD for long-term trades, consider setting up the following rules:
- Supplementary rule: MACD crosses below the signal line.
- Supplementary rule: MACD crosses below the zero line.
- Buy signal: MACD crosses the signal line and moves upward.
For short-term day trading, the setting should be as follows:
- Supplementary rule : MACD crosses above the signal line.
- Supplementary rule : MACD crosses above the zero line.
- Sell signal: MACD crosses the signal line and moves downward.
Sophisticated traders create their own patterns, based on their individual experiences. For instance, another popular set of parameters for MACD is 5, 35, and 5-period EMA, which is combined with weekly or monthly time frames. However, the high level of volatility in the cryptocurrency market makes the process much riskier. Thus, for newbies, sticking to the default parameters is recommended.
Avoid False MACD Signals
It’s important to say that MACD by itself can by no means be considered a magical pill to boost your profits — and it is surely an unreliable source of making decisions when treated outside of the general market context. It may often allure traders with false signals of a trend reversal.
For example, MACD may often cross above the signal line and point to a bullish crossover, while the asset price moves downward. Such a signal is referred to as “false positive.” In the same way, when MACD points to a bearish crossover while the price is still increasing, the signal is deemed a “false negative.”
In order not to fall into this trap, traders should always look out for other confluence signals. Ideally, at least three different signals should coincide and be followed by corresponding news or rumours. Then, you may buy or sell a selected crypto asset with higher confidence.
Conclusion
Moving average convergence divergence is a good technical analysis tool that’s both accurate and easy to implement. The MACD combines the momentum of the market as well as market trend to deliver a 2-in-1 indicator. You do not have to clutter your price charts and technical analysis environment with many indicators. However, it is always a good practice to blend your MACD with the Relative Strength Index. Be on the lookout for more versatile signals, to enhance correct trading decisions while relying on the strength of the MACD.
Sidebar rates
