Prices Forecast: Technical Analysis
For today, IOTA is predicted to close at approximately $0.0377, with a range between $0.0360 and $0.0395. Looking ahead to the week, the expected closing price is around $0.0385, with a potential range of $0.0365 to $0.0405. The technical indicators suggest a bearish trend, as the RSI is currently at 25.32, indicating oversold conditions. The ATR is low at 0.0028, suggesting reduced volatility, which may limit significant price movements in the short term. The pivot point is at $0.040, and since IOTA is trading below this level, it reinforces the bearish sentiment. Resistance levels are at $0.040, while support is found at $0.036. The market sentiment is cautious, with recent economic data indicating a mixed outlook for consumer sentiment and trade balance, which could further influence IOTA’s price. Overall, the combination of technical indicators and market conditions suggests a potential for slight upward movement, but significant gains may be limited.
Fundamental Overview and Analysis
IOTA has recently experienced a downward trend, with prices fluctuating around the $0.0377 mark. Factors influencing its value include ongoing developments in the IOTA ecosystem, particularly in the areas of scalability and partnerships. Investor sentiment appears cautious, as recent economic indicators show mixed results, particularly in consumer sentiment, which could affect overall market confidence. The asset’s potential for future growth lies in its unique technology and applications in the IoT space, but it faces challenges from competition and regulatory scrutiny. Currently, IOTA seems undervalued compared to its historical performance, suggesting a potential buying opportunity for long-term investors. However, market volatility and external economic factors pose risks that could impact its price trajectory. Overall, while there are opportunities for growth, investors should remain aware of the inherent risks in the current market environment.
Outlook for IOTA
The future outlook for IOTA appears cautiously optimistic, with potential for gradual recovery in the coming months. Current market trends indicate a consolidation phase, with prices stabilizing around the $0.0377 level. Key factors likely to influence IOTA’s price include advancements in its technology, partnerships, and broader market conditions. In the short term (1 to 6 months), IOTA could see a price movement towards $0.040, assuming positive developments in the ecosystem. Long-term forecasts (1 to 5 years) suggest that if IOTA can capitalize on its technological advantages, it may reach higher price levels, potentially exceeding $0.10. However, external factors such as regulatory changes and market sentiment will play a crucial role in determining its success. Investors should monitor these developments closely, as they could significantly impact IOTA’s price trajectory.
Technical Analysis
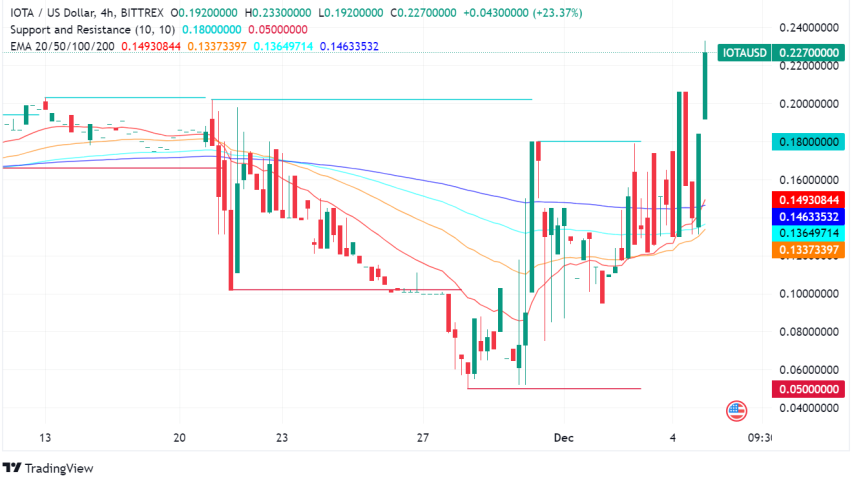
Current Price Overview: The current price of IOTA is $0.0377, which is a slight decrease from the previous close of $0.0377. Over the last 24 hours, the price has shown minimal volatility, indicating a stable market environment. Support and Resistance Levels: The identified support levels are $0.036, $0.035, and $0.034, while resistance levels are at $0.040, $0.041, and $0.042. The pivot point is at $0.040, and since IOTA is trading below this level, it suggests a bearish outlook. Technical Indicators Analysis: The RSI is at 25.32, indicating an oversold condition, which may suggest a potential reversal soon. The ATR is 0.0028, reflecting low volatility in the market. The ADX is at 15.94, indicating a weak trend. The 50-day SMA is at $0.057, and the 200-day EMA is at $0.060, showing no crossover currently. Market Sentiment & Outlook: The sentiment is currently bearish, as indicated by the price action below the pivot point, the low RSI, and the weak ADX. Investors should be cautious and consider potential buying opportunities if the price approaches support levels.
Forecasting Returns: $1,000 Across Market Conditions
The table below outlines potential investment scenarios for IOTA, providing insights into expected price changes and estimated returns based on different market conditions.
| Scenario | Price Change | Value After 1 Month |
|---|---|---|
| Bullish Breakout | +10% to ~$0.0415 | ~$1,100 |
| Sideways Range | 0% to ~$0.0377 | ~$1,000 |
| Bearish Dip | -10% to ~$0.0339 | ~$900 |
FAQs
What are the predicted price forecasts for the asset?
The predicted daily closing price for IOTA is approximately $0.0377, with a range between $0.0360 and $0.0395. For the weekly forecast, the expected closing price is around $0.0385, with a potential range of $0.0365 to $0.0405.
What are the key support and resistance levels for the asset?
The key support levels for IOTA are at $0.036, $0.035, and $0.034. The resistance levels are identified at $0.040, $0.041, and $0.042, with the pivot point at $0.040.
What are the main factors influencing the asset’s price?
The main factors influencing IOTA’s price include technological advancements, market sentiment, and economic indicators such as consumer sentiment and trade balance. Additionally, competition and regulatory changes can significantly impact its value.
What is the outlook for the asset in the next 1 to 6 months?
The outlook for IOTA in the next 1 to 6 months is cautiously optimistic, with potential price movements towards $0.040 if positive developments occur. However, market volatility and external economic factors will play a crucial role in determining its success.
What are the risks and challenges facing the asset?
IOTA faces several risks and challenges, including competition from other cryptocurrencies, market volatility, and regulatory scrutiny. These factors could impact its price trajectory and overall market performance.
Disclaimer
In conclusion, while the analysis provides a structured outlook on the asset’s potential price movements, it is essential to remember that financial markets are inherently unpredictable. Conducting thorough research and staying informed about market trends and economic indicators is crucial for making informed investment decisions.