Prices Forecast: Technical Analysis
For today, we predict a closing price for SushiSwap at **$0.1985**, with a range between **$0.195** and **$0.202**. Looking ahead to the week, we anticipate a closing price of **$0.205**, with a range of **$0.200** to **$0.210**. The technical indicators suggest a neutral to slightly bullish sentiment, as the RSI is at **53.0486**, indicating that the asset is neither overbought nor oversold. The ATR of **0.0126** suggests low volatility, which may lead to a more stable price movement in the short term. The pivot point is at **$0.19**, and since the current price is above this level, it indicates a bullish trend. Resistance levels at **$0.19** and **$0.2** may act as barriers to upward movement, while support at **$0.19** could provide a safety net for price dips. Overall, the combination of these indicators suggests a cautious optimism for SushiSwap’s price in the coming days.
Fundamental Overview and Analysis
SushiSwap has recently experienced a decline from a high of **$0.3015** to its current price of **$0.1961**, reflecting a broader trend in the crypto market. Factors influencing its value include the overall demand for decentralized finance (DeFi) platforms and the competitive landscape with other DEXs. Investor sentiment appears mixed, with some viewing the current price as a buying opportunity, while others remain cautious due to recent volatility. The potential for future growth lies in SushiSwap’s ability to innovate and expand its offerings, particularly in yield farming and liquidity provision. However, risks such as regulatory scrutiny and competition from other platforms could hinder its performance. Currently, SushiSwap seems fairly priced, considering its recent performance and market conditions.
Outlook for SushiSwap
The future outlook for SushiSwap appears cautiously optimistic, with potential for recovery in the coming months. Current market trends indicate a gradual increase in interest in DeFi projects, which could positively impact SushiSwap’s price. In the short term (1 to 6 months), we expect the price to stabilize between **$0.200** and **$0.220**, driven by increased user engagement and liquidity. Long-term (1 to 5 years), if SushiSwap can maintain its competitive edge and adapt to market changes, it could see prices reaching **$0.300** or higher. External factors such as regulatory developments and technological advancements will play a crucial role in shaping its trajectory. Overall, while there are challenges ahead, the potential for growth remains strong.
Technical Analysis
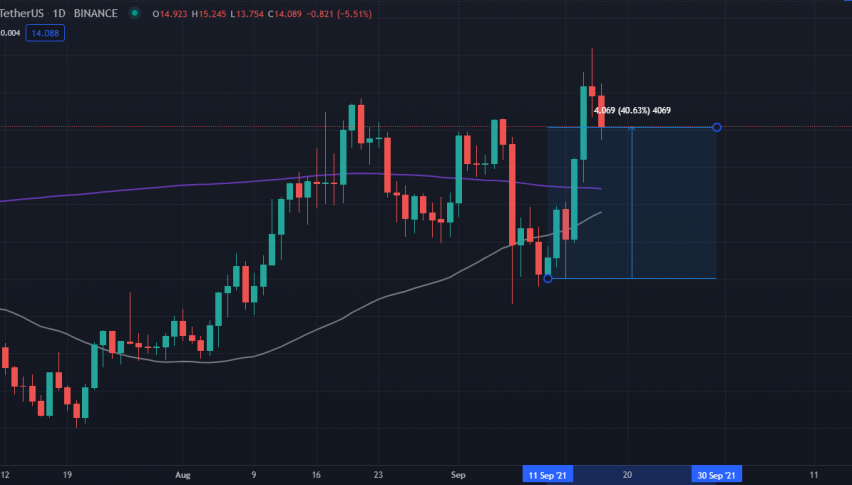
**Current Price Overview:** The current price of SushiSwap is **$0.1961**, down from the previous close of **$0.1813**. Over the last 24 hours, the price has shown a slight upward trend, indicating a potential recovery phase. **Support and Resistance Levels:** Key support levels are at **$0.19**, **$0.18**, and **$0.19**, while resistance levels are at **$0.19**, **$0.19**, and **$0.20**. The pivot point is at **$0.19**, and since the price is currently above this level, it suggests a bullish sentiment. **Technical Indicators Analysis:** The RSI at **53.0486** indicates a neutral trend, while the ATR of **0.0126** suggests low volatility. The ADX is at **12.7611**, indicating a weak trend. The 50-day SMA is at **$0.206**, and the 200-day EMA is at **$0.211**, showing no significant crossover yet. **Market Sentiment & Outlook:** Sentiment is currently neutral to slightly bullish, as the price is above the pivot point, and the RSI indicates room for upward movement.
Forecasting Returns: $1,000 Across Market Conditions
The table below outlines potential investment scenarios for SushiSwap, providing insights into expected returns based on different market conditions. Investors should consider these scenarios when deciding whether to invest $1,000 in SushiSwap.
| Scenario | Price Change | Value After 1 Month |
|---|---|---|
| Bullish Breakout | +10% to ~$0.2167 | ~$1,100 |
| Sideways Range | 0% to ~$0.1961 | ~$1,000 |
| Bearish Dip | -10% to ~$0.1765 | ~$900 |
FAQs
What are the predicted price forecasts for the asset?
The predicted daily closing price for SushiSwap is **$0.1985**, with a range of **$0.195** to **$0.202**. For the weekly forecast, we anticipate a closing price of **$0.205**, ranging from **$0.200** to **$0.210**.
What are the key support and resistance levels for the asset?
Key support levels for SushiSwap are at **$0.19**, **$0.18**, and **$0.19**. Resistance levels are at **$0.19**, **$0.19**, and **$0.20**. The pivot point is at **$0.19**, indicating a bullish sentiment as the price is currently above this level.
What are the main factors influencing the asset’s price?
Factors influencing SushiSwap’s price include overall demand for DeFi platforms, competition from other DEXs, and regulatory scrutiny. Investor sentiment is mixed, with some viewing the current price as a buying opportunity.
What is the outlook for the asset in the next 1 to 6 months?
In the short term, we expect SushiSwap’s price to stabilize between **$0.200** and **$0.220**. This is driven by increased user engagement and liquidity in the DeFi space.
What are the risks and challenges facing the asset?
Risks facing SushiSwap include regulatory challenges, competition from other platforms, and market volatility. These factors could hinder its performance and affect investor sentiment.
Disclaimer
In conclusion, while the analysis provides a structured outlook on the asset’s potential price movements, it is essential to remember that financial markets are inherently unpredictable. Conducting thorough research and staying informed about market trends and economic indicators is crucial for making informed investment decisions.