Candlestick – Forex Trading Strategies
Candlestick charts are among the most widely used chart types by retail traders and investors, offering a clear and comprehensive view of market activity.
Unlike line charts or bar charts, which provide limited information, candlestick charts tell a detailed story of price action, highlighting trends, momentum shifts, and potential reversal points. Their ability to visually represent market sentiment makes them an essential tool in both short-term trading and long-term investing strategies.
Originating from historical Japanese rice trading practices, candlestick charting has evolved into a cornerstone of modern technical analysis. When traders rely solely on technical analysis to predict future price movements, they base their decisions on past price behavior—precisely where candlestick patterns excel. These charts help identify potential opportunities by analyzing how price has reacted under similar conditions in the past.
Candlestick analysis is particularly effective in volatile market conditions, offering precise signals during rapid price swings. However, it remains reliable even in more stable markets, providing traders with actionable insights whether used independently or in combination with other technical indicators like moving averages or RSI.

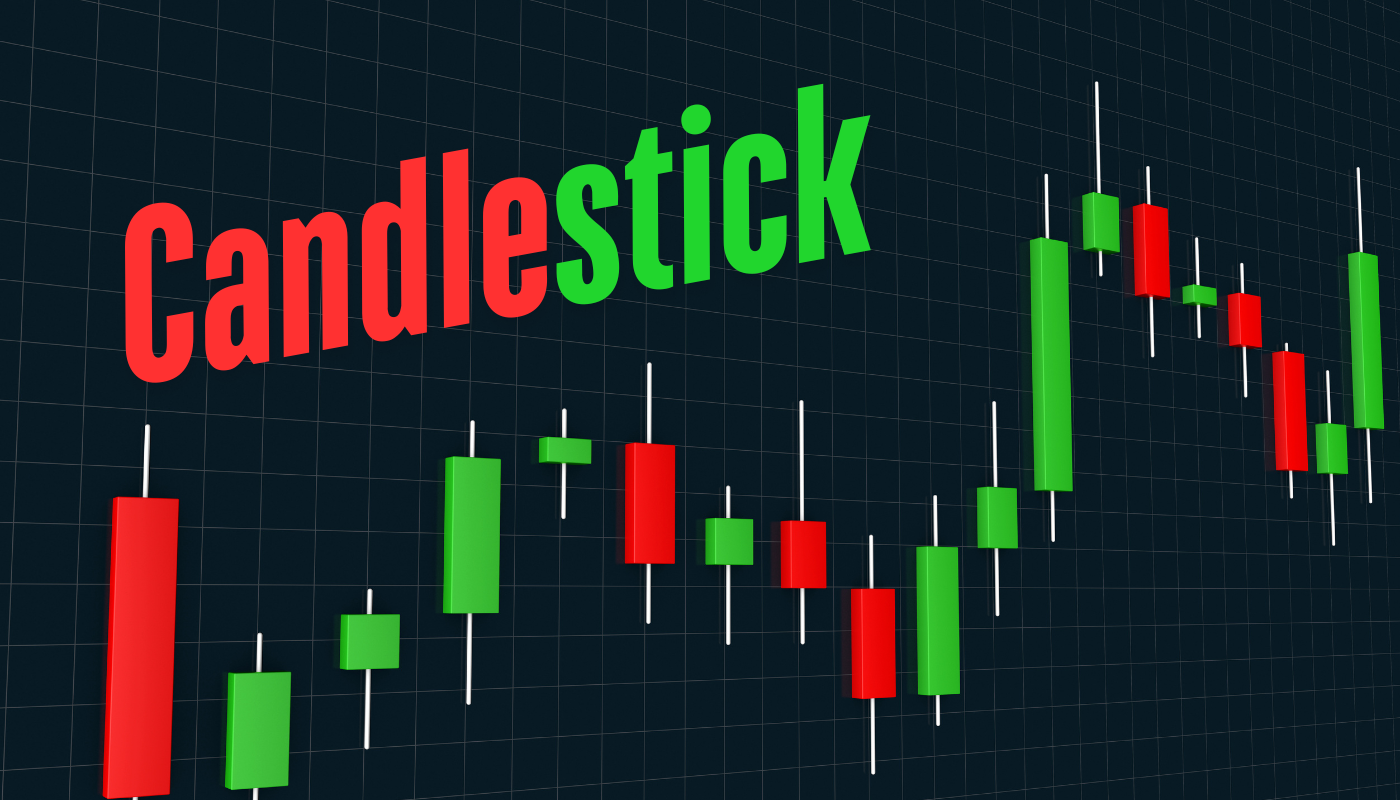
In candlestick trading, a green candle is bullish and a red candle is bearish.
Each candlestick represents price fluctuations over a specified period, which can range from as little as one minute to as long as a month. The body of the candlestick reflects the difference between the opening and closing prices, while the thin vertical lines, known as wicks or shadows, indicate the highest and lowest prices reached during that timeframe.
- Bullish Candlestick (Green): Occurs when the closing price is higher than the opening price, signaling upward momentum.
- Bearish Candlestick (Red): Indicates that the closing price is lower than the opening price, reflecting downward pressure.
While green and red are commonly used to represent bullish and bearish candles, traders can customize these colors based on personal preferences. Ultimately, the power of candlestick charts lies in their simplicity, versatility, and the depth of information they provide for making well-informed trading decisions.
What are Candlestick Patterns?
Definition and Explanation
Candlestick patterns are visual representations of price movements in financial markets, used to identify potential trading opportunities. These patterns are formed by the combination of one or more candlesticks, which graphically depict price action over a specific period. By analyzing candlestick patterns, traders can gain valuable insights into market sentiment, potential trend reversals, and optimal entry and exit points for trades. Understanding these patterns is crucial for making informed trading decisions and anticipating market movements.
Types of Candlestick Patterns
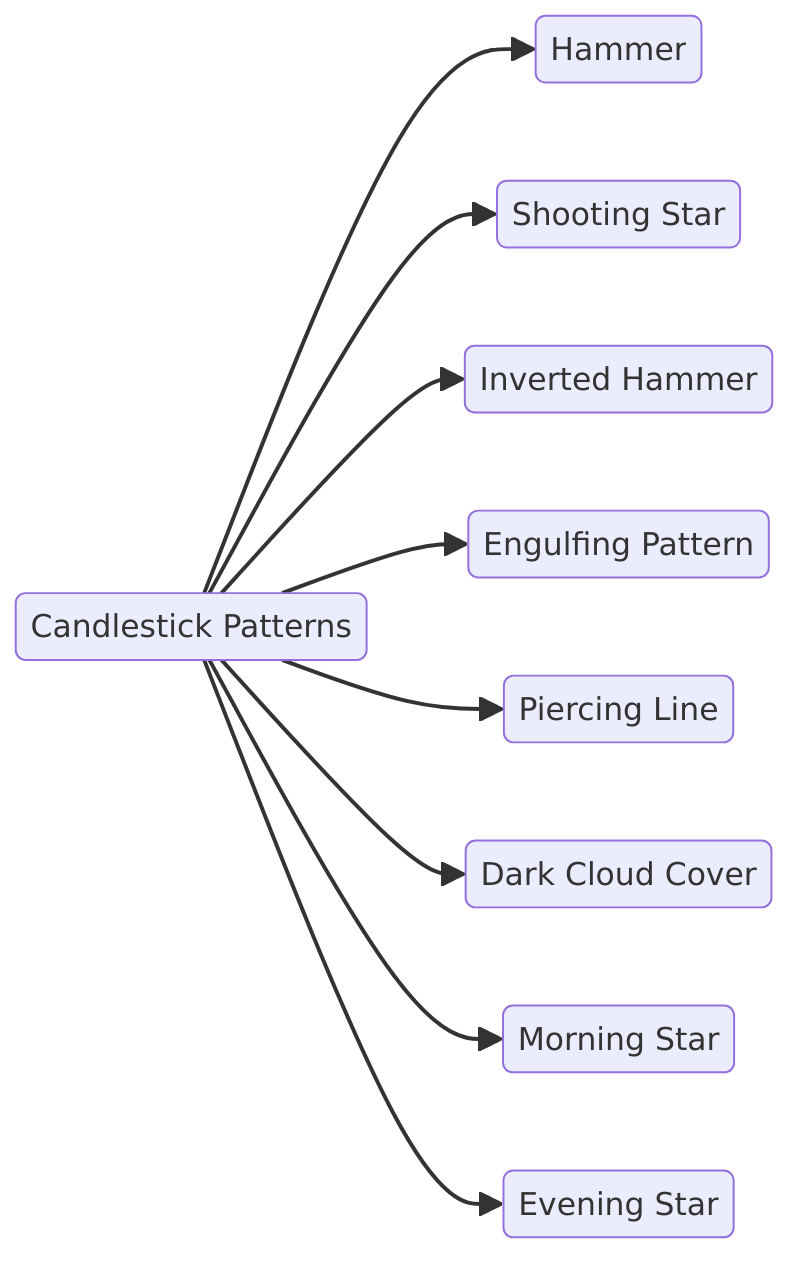
There are various types of candlestick patterns, each with its unique characteristics and implications for trading decisions. These patterns can be categorized into single-candlestick, double-candlestick, and triple-candlestick formations. Some of the most popular candlestick patterns include:
- Hammer: Indicates a potential bullish reversal after a downtrend.
- Shooting Star: Suggests a potential bearish reversal after an uptrend.
- Inverted Hammer: Signals a possible bullish reversal, similar to the hammer but with a different shape.
- Engulfing Pattern: Consists of a larger candlestick engulfing the body of the previous candlestick, indicating a potential reversal. This can be either bullish or bearish.
- Piercing Line: A bullish pattern that suggests a reversal after a downtrend.
- Dark Cloud Cover: A bearish pattern indicating a potential reversal after an uptrend.
- Morning Star: A bullish reversal pattern formed by three candlesticks, indicating the end of a downtrend.
- Evening Star: A bearish reversal pattern formed by three candlesticks, signaling the end of an uptrend.
Each of these candlestick patterns provides traders with clues about the market’s direction and potential price movements.
How to Identify Candlestick Patterns in Charts
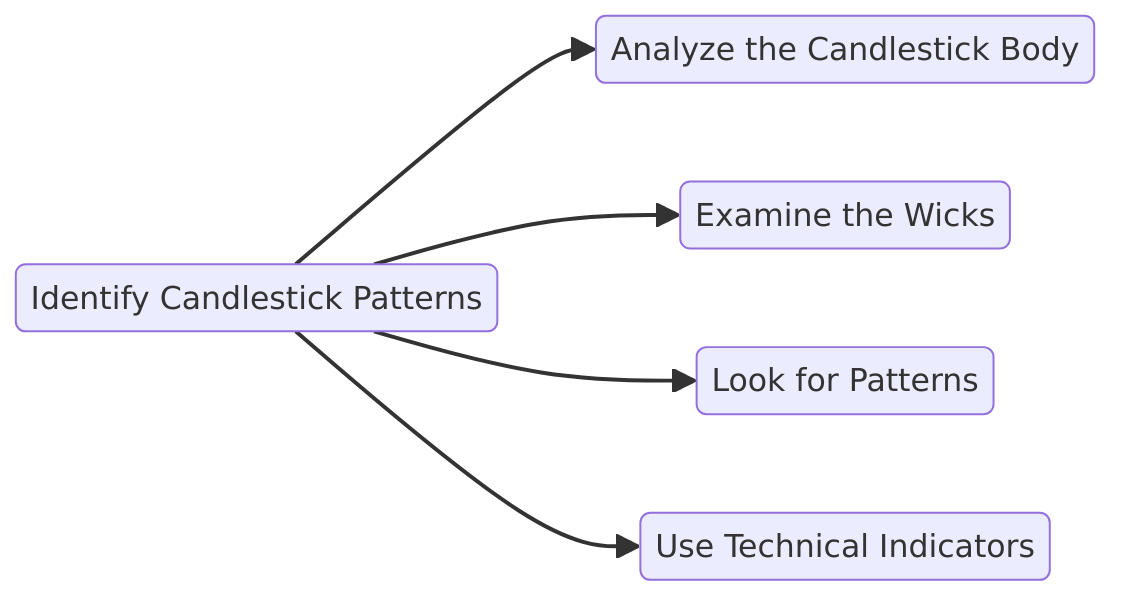
To identify candlestick patterns in charts, traders need to carefully analyze the shape and structure of the candlesticks. This involves examining the opening and closing prices, high and low prices, and the relationship between consecutive candlesticks. Here are some steps to help identify candlestick patterns:
- Analyze the Candlestick Body: Look at the body of the candlestick to determine if it is bullish (closing price higher than opening price) or bearish (closing price lower than opening price).
- Examine the Wicks: The wicks, or shadows, show the range of price movement during the period. Long wicks can indicate strong market reactions.
- Look for Patterns: Identify common patterns such as hammers, engulfing patterns, and stars by comparing the current candlestick with previous ones.
- Use Technical Indicators: Confirm the presence of a candlestick pattern with technical indicators like moving averages, RSI, or MACD to make more informed trading decisions.
By following these steps, traders can effectively identify candlestick patterns and use them to predict future price movements.
How Are Candlesticks Formed on a Trading Chart?
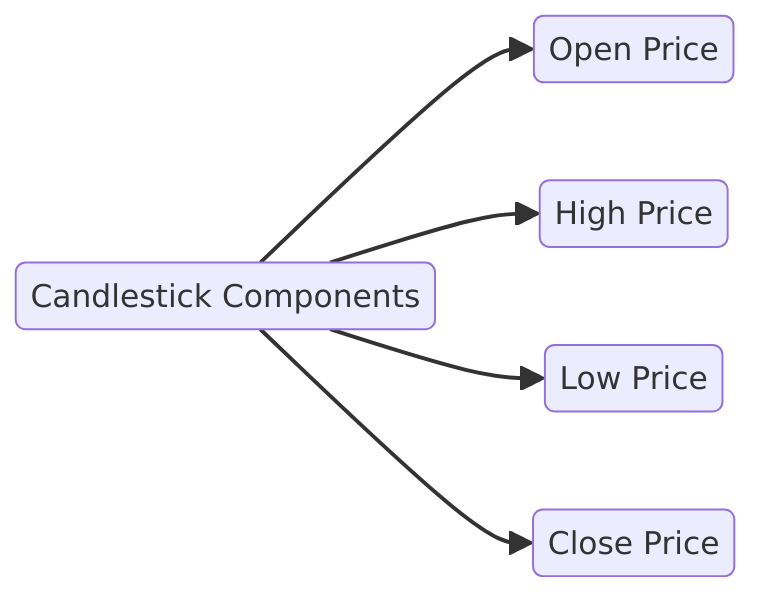
Candlestick Components
A candlestick is formed by the combination of four key components: the open, high, low, and close prices. These components provide a comprehensive view of price action during a specific period:
- Open Price: The price at which the market opens for the period.
- High Price: The highest price reached during the period.
- Low Price: The lowest price reached during the period.
- Close Price: The price at which the market closes for the period.
The body of the candlestick represents the difference between the opening and closing prices. If the closing price is higher than the opening price, the candlestick is typically colored green or white, indicating a bullish trend. Conversely, if the closing price is lower than the opening price, the candlestick is usually colored red or black, indicating a bearish trend.
The wicks, or shadows, extend from the body to the high and low prices, showing the range of price movement during that period. The upper wick extends from the top of the body to the high price, while the lower wick extends from the bottom of the body to the low price. By analyzing these components, traders can gain insights into market dynamics and potential future price movements.
In candlestick trading, a green candle is bullish and a red candle is bearish.
Now that we have explained what a candlestick is, let’s see the different shapes that a candlestick can take.
Candlestick Trading: Popular Chart Patterns
In technical analysis, candlestick patterns play a key role in shaping trading strategies by highlighting potential entry and exit points. Their unique formations provide visual cues about market sentiment, helping traders interpret price behavior with precision. When combined with key support and resistance levels and indicators like moving averages, candlestick patterns become even more powerful, offering insights into potential reversals, continuations, or consolidations.
Let’s explore some of the most recognizable and effective candlestick patterns used in forex trading.
1. Doji Candlestick Pattern
A Doji forms when an asset’s opening and closing prices are nearly identical, creating a small or non-existent body with long wicks on either side. This pattern reflects indecision in the market, where both buyers and sellers attempt to control the price but ultimately reach a stalemate.
- Key Insights:
- After an Uptrend: A Doji signals that bullish momentum is weakening, and sellers are starting to gain control. This often precedes a potential reversal or at least a temporary pullback.
- After a Downtrend: The same logic applies in reverse, indicating that selling pressure may be losing steam, suggesting a possible shift towards a bullish trend.
- Variations of the Doji:
- Long-Legged Doji: Reflects extreme indecision with long upper and lower wicks.
- Dragonfly Doji: Signals bullish potential when appearing after a downtrend.
- Gravestone Doji: Indicates bearish pressure, especially after an uptrend.
Left – a typical doji candlestick Right – reversal indicated by doji candlestick.

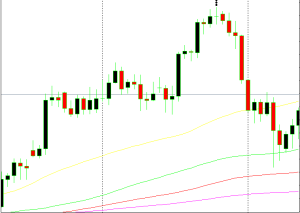
Left – a typical doji candlestick
Right – reversal indicated by doji candlestick.
2. Pin Bars (Reversal Candlestick Patterns)
A Pin Bar, also known as a reversal pin, is characterized by a small body with a long wick, indicating strong rejection of a particular price level. The direction of the wick provides valuable insights into potential price reversals or continuations.
- Bullish Pin Bar (Downtrend Reversal):
- The price drops below the opening level but rebounds strongly, closing near or above the opening price.
- This suggests that buyers overpowered sellers, signaling a possible reversal from bearish to bullish momentum.
- Bearish Pin Bar (Uptrend Reversal):
- The price rises above the opening but fails to sustain gains, closing near or below the opening price.
- Indicates that sellers have taken control, hinting at a potential trend reversal.

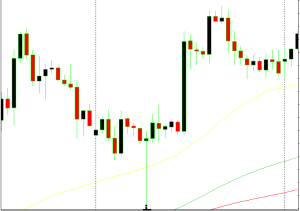
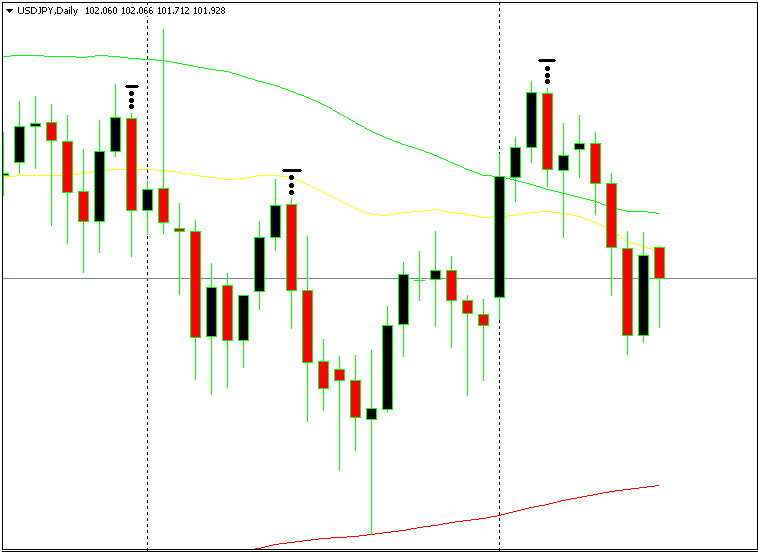
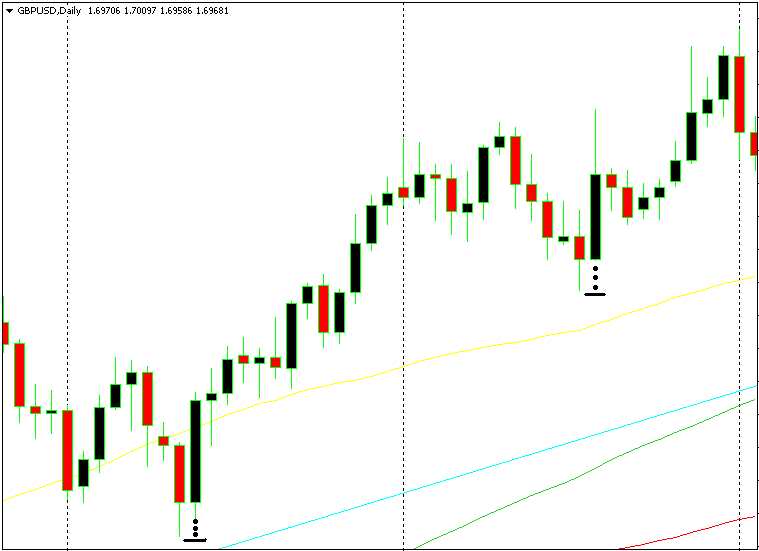
In a downtrend, a pin candlestick usually indicates a reversal.
In an uptrend, pin candlesticks usually indicate the continuation of the trend.
Reverse pins are the same as pins but act on the opposite direction. The candle opens, bulls have a go, and then the bears charge in to take the price back to the opening level. In an uptrend, this means that a downtrend is about to begin — in a downtrend, a reversal pin indicates a trend continuation.

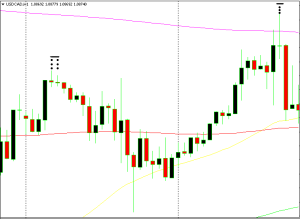
In an uptrend, reverse pin candlesticks usually indicate the beginning of a bearish trend.
How to Use These Patterns Effectively:
- Confirm with Indicators: Always validate candlestick signals with technical tools like RSI, moving averages, or MACD to avoid false breakouts.
- Consider Market Context: Look for these patterns near key support or resistance levels for higher accuracy.
- Combine with Volume Analysis: A strong reversal signal is often supported by increased trading volume, confirming market sentiment.
Understanding candlestick formations like Dojis and Pin Bars can significantly enhance trading decisions, especially when integrated into a broader technical analysis framework.
Hammers and Inverted Hammers in Candlestick Trading
In candlestick trading, hammers and inverted hammers are powerful patterns that signal potential trend reversals or continuations. While they share similarities with pin bars and reverse pins, hammers generally reflect stronger momentum due to their distinctive shape and the underlying market psychology they represent.
1. Hammer Candlestick Pattern (Bullish Reversal)
A hammer forms during a downtrend and is characterized by a small body near the top of the candle with a long lower wick (shadow). This pattern indicates that although sellers initially pushed the price lower, buyers regained control, driving the price back above the opening level by the close.
- Key Characteristics:
- Opening and Closing Price: The candle closes near or above the opening price.
- Lower Wick: The wick is typically at least twice the size of the body, signaling strong rejection of lower prices.
- No or Small Upper Shadow: Indicates limited upward price movement beyond the close.
- What It Signals:
A hammer suggests that bearish momentum is weakening, and a potential bullish reversal may follow. The larger the lower wick, the stronger the signal, as it reflects aggressive buying pressure after initial selling.


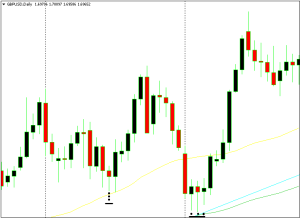
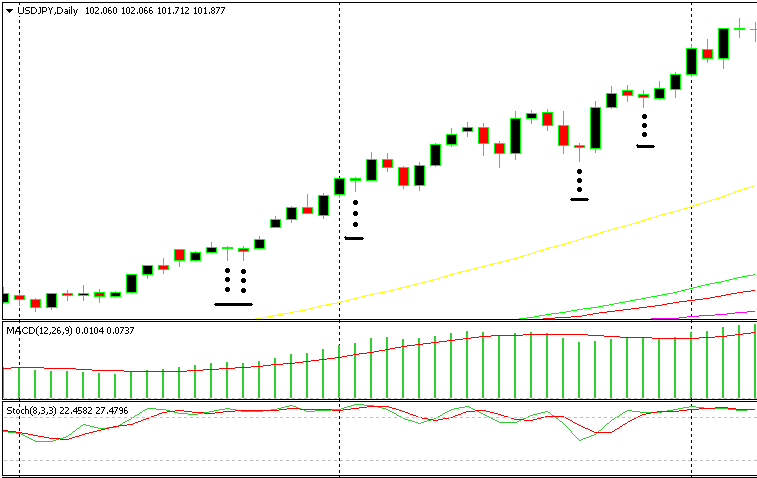
Hammers indicate trend reversal is in place.
2. Inverted Hammer (Bearish Reversal or Continuation)
An inverted hammer appears at the end of a downtrend and has a small body with a long upper wick and little to no lower shadow. Despite opening lower, buyers pushed the price significantly higher during the session, but sellers managed to pull it back near the open by the close.
- Key Characteristics:
- Long Upper Wick: Indicates that buyers attempted to push the price up but faced resistance from sellers.
- Small Body: Reflects indecision, with neither buyers nor sellers fully dominating.
- Minimal Lower Wick: Suggests limited downward movement.
- What It Signals:
An inverted hammer can signal a potential bullish reversal, but confirmation is needed—often in the form of a strong bullish candle following the pattern.
Inverted hammer in an uptrend indicates a reversal of the trend.
Morning Star and Evening Star Patterns in Candlestick Trading
In candlestick trading, the Morning Star and Evening Star are powerful reversal patterns that signal potential shifts in market trends. Both formations consist of three candlesticks and provide clear visual cues about changing market sentiment.
1. Morning Star Pattern (Bullish Reversal)
The Morning Star signals the end of a downtrend and the potential start of a bullish reversal. This pattern represents a shift from bearish to bullish sentiment, much like the rising sun signals the start of a new day—hence the name.
- Formation:
- Bearish Candle: A strong red candle reflecting intense selling pressure.
- Indecisive Candle (Doji or Small Body): Shows market indecision, where neither buyers nor sellers dominate. This could be a doji, spinning top, or a small-bodied candle.
- Bullish Candle: A strong green candle that closes well into the body of the first candle, confirming a shift in momentum.


- Key Features:
- The middle candle signals indecision, acting as a turning point.
- Gaps between the candles are ideal, but in forex markets, gaps are rare due to continuous trading. The pattern remains valid without them.
- What It Signals:
A Morning Star pattern suggests that sellers are losing control, and buying momentum is building, often leading to an upward price movement.
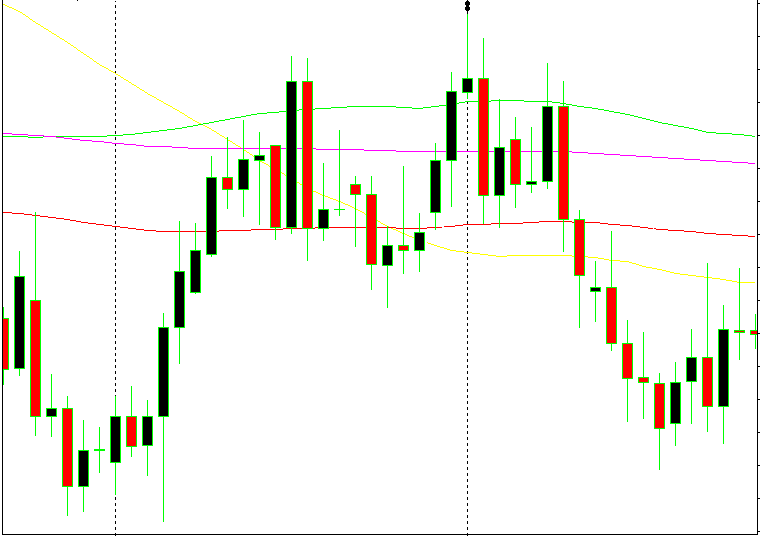
Evening and morning stars always indicate a reversal.
2. Evening Star Pattern (Bearish Reversal)
The Evening Star is the opposite of the Morning Star. It signals the end of an uptrend and a potential shift toward a bearish reversal. Think of it like the setting sun, marking the close of a bullish day.
- Formation:
- Bullish Candle: A strong green candle reflecting strong buying activity.
- Indecisive Candle (Doji or Small Body): Indicates uncertainty among traders, with neither side in full control.
- Bearish Candle: A strong red candle that closes deep into the body of the first candle, confirming bearish dominance.


- Key Features:
- The middle candle’s small body highlights a potential loss of bullish momentum.
- While gaps between the candles add strength to the pattern, they are not always present in forex markets.
- What It Signals:
The Evening Star suggests that buyers are losing strength, and selling pressure is starting to dominate, often leading to a downward price move.
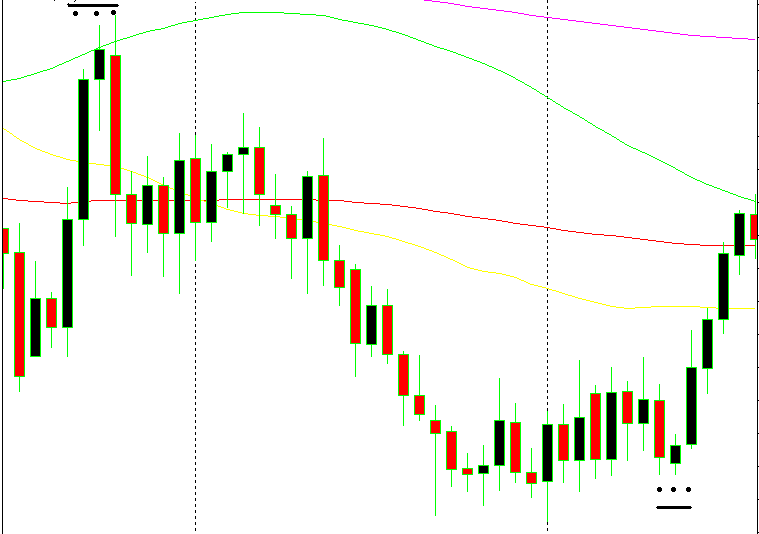
Bearish engulfing reversal – falls follow each bearish engulfing candle.
Bullish engulfing reversal and continuation – bullish engulfing formation are followed by rises in the price.
Conclusion: The Power of Candlestick Trading Strategies
Candlestick charts remain one of the most powerful tools for traders, offering clear insights into market sentiment, price movements, and potential trend reversals. Their ability to visually represent the battle between buyers and sellers makes them invaluable for both novice and experienced traders. Unlike simple line or bar charts, candlestick patterns provide a comprehensive view of price action, helping traders make well-informed decisions based on historical trends.
Through patterns like Doji, Pin Bars, Hammers, Morning/Evening Stars, and Engulfing Patterns, traders can identify key entry and exit points, manage risks, and optimize their trading strategies. While these patterns offer strong signals, combining candlestick analysis with other technical tools—such as moving averages, RSI, or support and resistance levels—can significantly improve accuracy.
Ultimately, the simplicity and versatility of candlestick trading strategies make them an essential part of any trader’s toolkit. Whether navigating volatile markets or stable trends, understanding candlestick patterns provides the edge needed to stay ahead in the dynamic world of trading
Frequently Asked Questions (FAQs) About Candlestick Trading Strategies
- What are candlestick patterns in forex trading?
Candlestick patterns are visual formations on price charts that represent the open, high, low, and close of an asset within a specific timeframe. These patterns help traders predict potential trend reversals, continuations, or market indecision. - How do candlestick patterns help in trading decisions?
They highlight market sentiment by showing the balance between buyers and sellers. Patterns like the Bullish Engulfing suggest strong buying pressure, while patterns like the Evening Star indicate a potential bearish reversal. - Are candlestick patterns reliable for predicting trends?
While candlestick patterns are valuable, they’re most effective when used with other technical indicators like RSI, MACD, and moving averages to confirm signals and reduce false breakouts. - What is the difference between bullish and bearish candlestick patterns?
- Bullish patterns (e.g., Morning Star, Hammer) signal potential upward price movements.
- Bearish patterns (e.g., Evening Star, Bearish Engulfing) indicate downward trends or trend reversals.
- Can candlestick patterns be used in all markets and timeframes?
Yes, candlestick patterns are versatile and can be applied to forex, stocks, commodities, and even cryptocurrencies across different timeframes—from 1-minute charts to monthly charts, depending on the trader’s strategy.