USD/JPY – Another Pair Approaching Important Technical Levels
Many forex pairs have made some substantial moves during the havoc we have seen in the forex market during the last two days. EUR/USD is one of those pairs; it moved nearly 300 pips higher in just two days reaching 1.1120s, which is just below the 50 and 100 moving averages on the daily forex chart, so we decided to open a long term forex signal in this pair.
USD/CHF and GBP/USD are also presenting us with some good trading opportunities, but the negative sentiment in the market makes safe haven crosses such as the CHF pairs, too dangerous right now. As for GBP/USD, we´re still waiting for a better entry price higher up, as we explained in one of our updates yesterday.
Now, another major forex pair is getting close to a very important level. The pair is USD/JPY and the level is 100. That´s the mother of all levels here and everyone is looking at it for support. The price still has some distance to cover before it gets there, but a 250 decline means that half the job is done.
The problem with such big levels is that, if they crack then everyone will start running for the hills and the avalanche which will form in no time, can sweep us off the ground. But, trading forex means that we take the risk, hoping for bigger rewards. A forex trader can never avoid the risk, risk is always present, but we must know when to step up and take it.
This is one those cases when the risk seems manageable and the risk/reward ratio justifies the trade. Entering a long position just above the 100 support level would be great and we might even get there; there are still about four working days to go until the US presidential elections are over and the wig-Man has advanced lately after Clinton´s email case was reopened by FBI.
 It looks tempting to buy now, but we´ll wait a bit longer
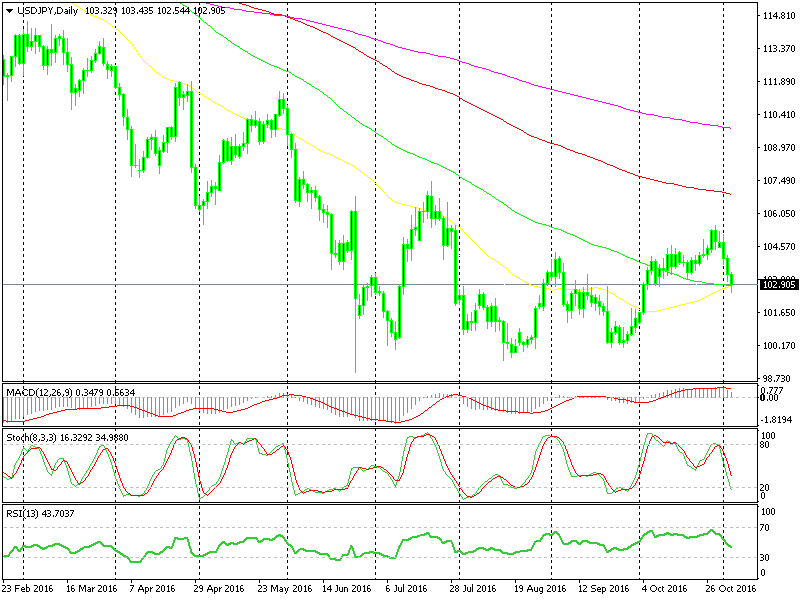
Still, even as this forex pair stands right now the long trade option seems lucrative. The price is sitting just above the 50 and 100 simple moving averages and the Stochastic and RSI indicators are almost oversold as you can see from the daily USD/JPY chart above. So from this perspective, a long term buy forex signal would be the way to go right now.
But the monthly and the weekly charts paint a different picture. The 100 smooth moving average (SMA) on the monthly chart and the 200 SMA on the weekly chart are providing solid resistance. Besides that, the stochastic indicator is overbought on the weekly USD/JPY chart. The higher timeframe charts are in contradiction with the daily chart, which casts a doubt on this trade.
That said, if we ignore the last few days, the market sentiment towards this pair seems to have switched from negative to positive. Remember, since January this pair has dived hard despite strong actions and threats from the BOJ (Bank of Japan), nothing could keep it up. But, although the BOJ has literally given up trying to sink the Yen (USD/JPY up) the pressure has worn off. The global business environment has improved and so has the sentiment in the last two months and that´s all the USD/JPY buyers need.
This 250 pip decline of the last few days comes as a result of panic/position adjustment before the US elections, so once the elections are out of the way, I am pretty confident the sellers will take cover and the buyers will return. The problem is, whether the reverse will start before the elections or after the elections. Should we buy USD/JPY now and target 108 or wait until the elections are over? As always, the dilemmas are present for a forex trader and the timing is crucial.


