Double Top Threatens USD/JPY Advance; Watch out for Mr. Trump Tomorrow
Good day fellow traders. I hope you’re coping well with the choppy market conditions. Unfortunately, phases of consolidation are part of trading, and that is exactly what we’re seeing in some currency pairs at the moment.
USD/JPY – The Mighty Advance Got Halted
The USD/JPY has also been trading sideways for the last couple of days. This pair has a tendency to sometimes fall into sideways ruts for long periods of time. Hopefully, it will not happen at this stage.
Ranging markets are a frustration to many traders, of which I am one. Sometimes I catch a few pips trading ranges, but the biggest potential lies in strong trending markets. Let’s jump to a few charts…
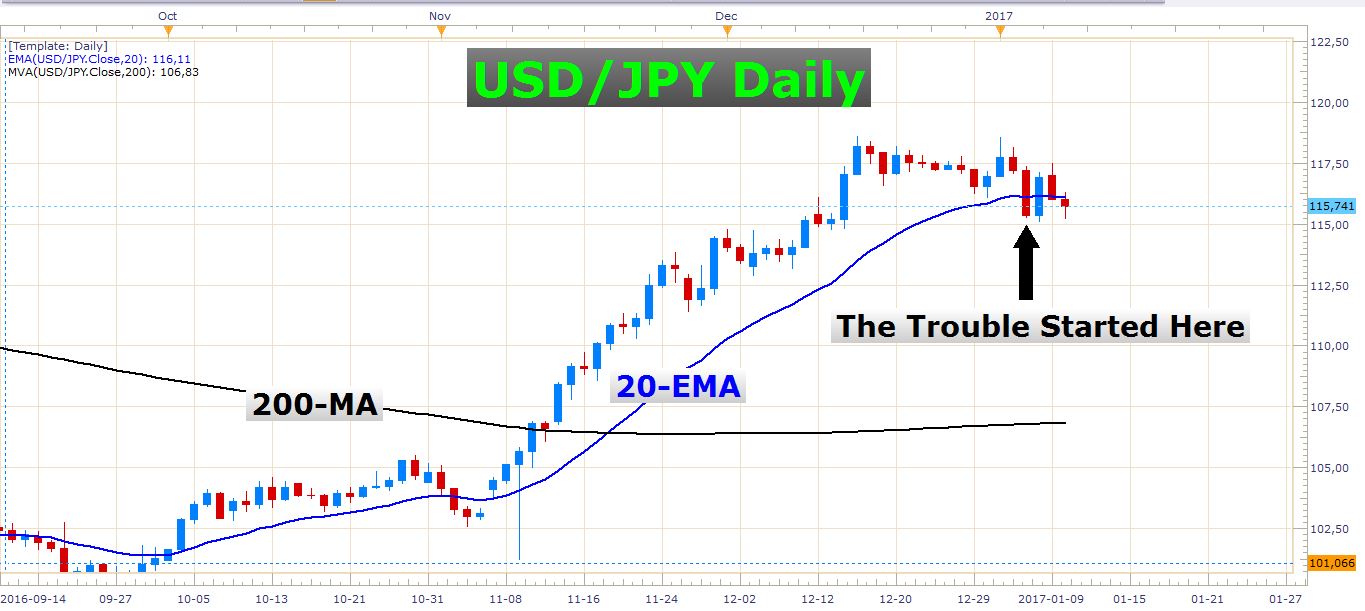 USD/JPY Daily Chart
The first few days of this consolidation has the character of a bull flag formation. The thing that upset the applecart, was this aggressive bearish candle which is marked by the black arrow in the chart above. But was this the first sign of weakness? Perhaps there was an early warning sign. Let’s zoom in a bit closer…
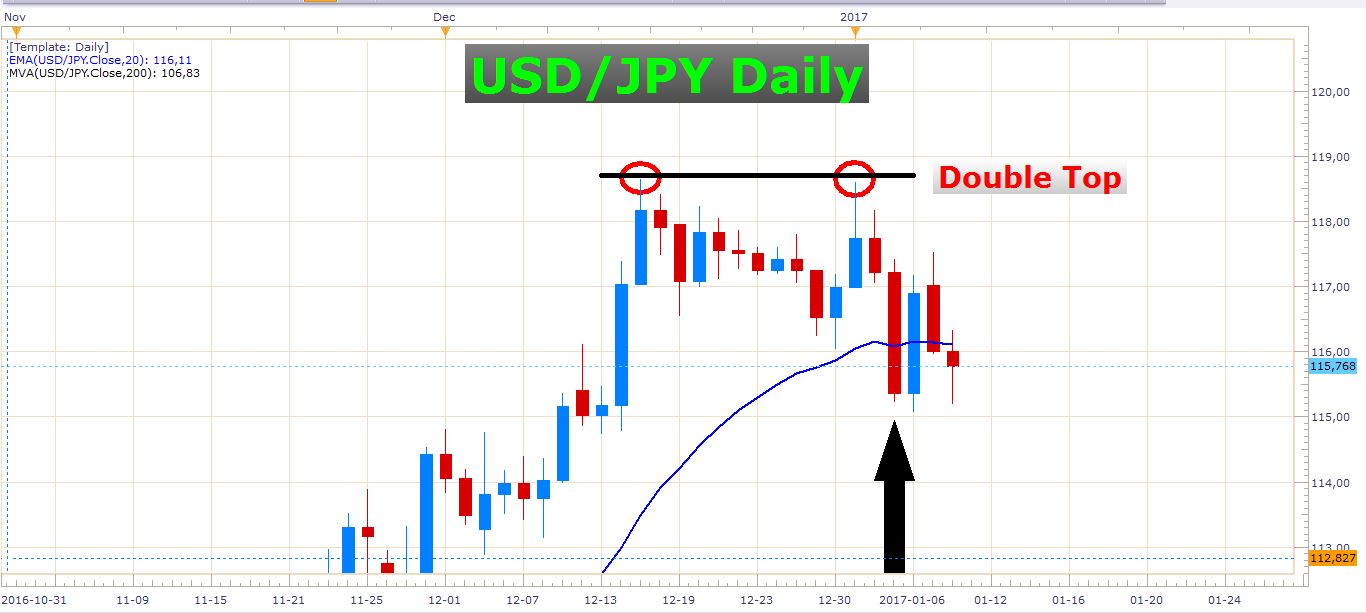 USD/JPY Daily Chart
Two days before this aggressive bearish candle (marked with the black arrow) was formed, the pair pushed up to the former swing high, but was unable to break through it and print a new high. After this rise, the pair was pushed down by the sellers and closed about 85 pips off the daily high. This candle in itself revealed some elements of weakness, which was, of course, confirmed by the two candles which followed.
First of all, this candle rejected off an important resistance level, and secondly, it posted a rather weak close, although the close was higher than the day’s opening price (the candle is blue). So if you were very attentive to the price action on this pair, you might have picked up an early warning sign.
I actually expected the USD/JPY to encounter some resistance at the current levels. Look at this chart that I posted on the 27th of November last year:
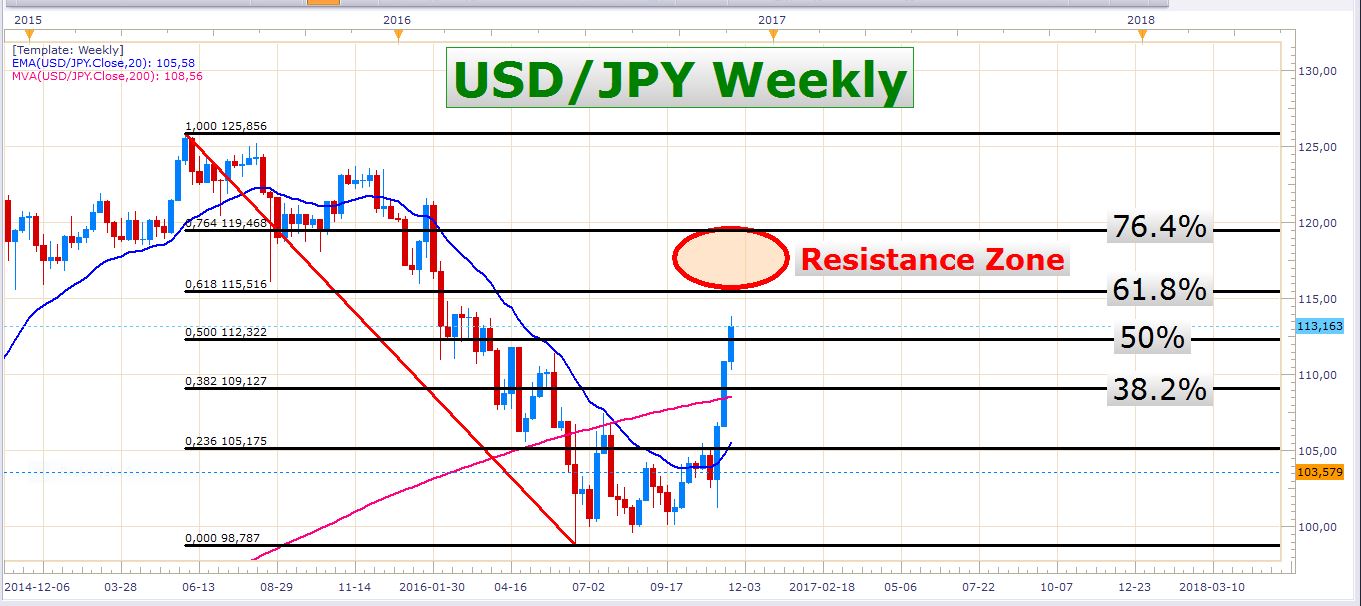 USD/JPY Weekly Chart (2016/11/27)
Now let’s look at how this chart unfolded in the meanwhile:
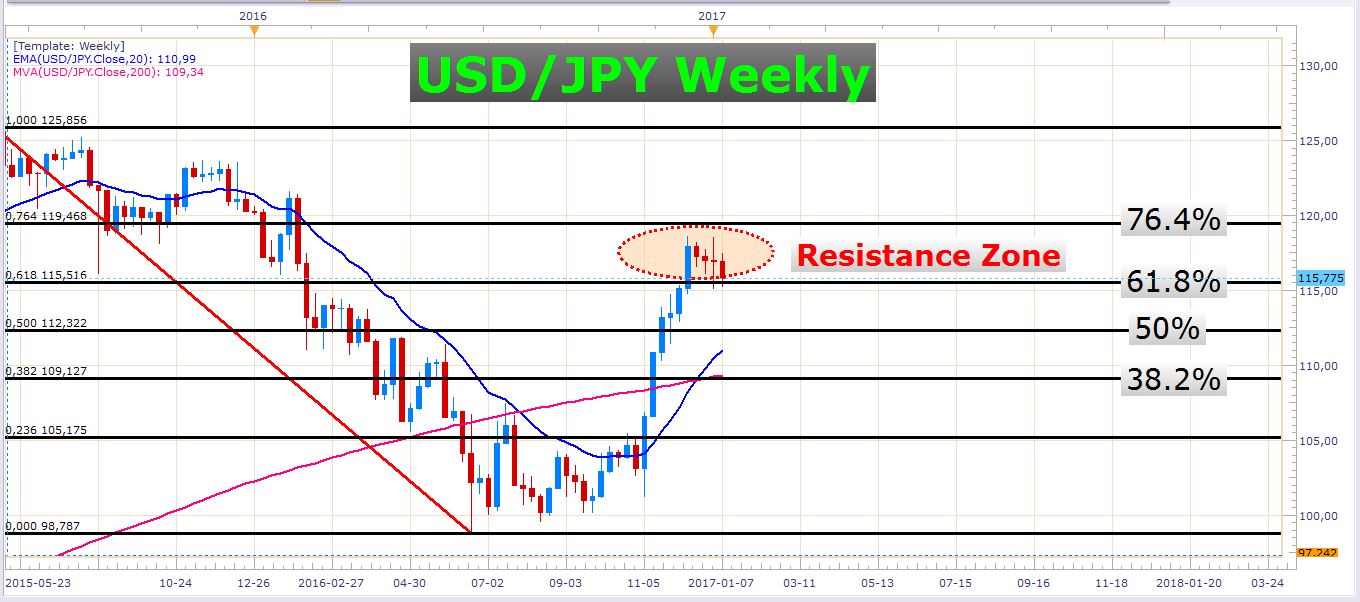 USD/JPY Weekly Chart (Updated)
From my experience, I know that currency pairs often have difficulty clearing the 61.8% to 76.4% Fibonacci retracement zone like the one in this chart. This is exactly where the USD/JPY encountered some strong headwinds, as you can see in the chart above.
Will we see a trend reversal at these levels? Perhaps, but not necessarily. On the above chart, you will notice that the recent consolidation looks like a bull flag, which suggests a further rise in the exchange rate. I would not be surprised, however, if this pair kept on chopping around in a range-bound fashion in the near future.
Trump Press Conference
The brand new US president, Donald Trump, announced earlier today (Tuesday) that he will hold his next press conference tomorrow in New York City.
This event will undoubtedly draw the focus of market players, big and small. We cannot exclude large market movements, so be careful with open trade exposure tomorrow.
All the best, good luck trading out there!
- Check out our free forex signals
- Follow the top economic events on FX Leaders economic calendar
- Trade better, discover more Forex Trading Strategies
- Open a FREE Trading Account
- Read our latest reviews on: Avatrade, Exness, HFM and XM
Related Articles


Sidebar rates
Related Posts
