USD/JPY – Did We Miss A Second Chance?
Yesterday, we closed our long term USD/JPY signal which we opened a few days ago near 114. So we made a hefty 100+ pips from that forex signal, although the profit might have been bigger if we had let it run a little longer.
If you remember, we mentioned the 11440-50 level in our market update yesterday. That turned into a support level for most of the day yesterday, so we highlighted that as a possible entry level for another long term forex signal.
Well, the price did retrace to that support level during the night and we weren´t able to enter that forex trade. This is a meaningful level in all timeframe charts; we can find around here the 50 SMA on the daily forex chart, the 100 and 50 SMAs on the H4 USD/JPY chart, and the 100 SMA on the hourly chart below.
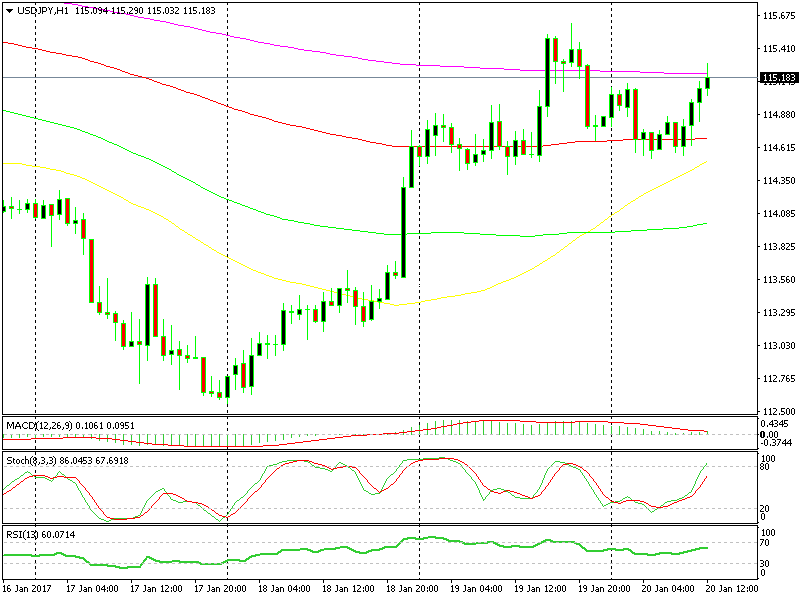
The buyers have taken this pair 70 pips higher this morning, so that opportunity looks a bit far behind now. But the hourly chart is now overbought and USD/JPY bulls are finding trouble breaking above the 200 SMA in pink.
If a forex pair is not able to go up, then it must come down. So I´m still waiting for the price to come back to 11440s if the 200 SMA does hold. A retest of this support level and failure to break below it will be an even stronger indicator for the upside.
- Check out our free forex signals
- Follow the top economic events on FX Leaders economic calendar
- Trade better, discover more Forex Trading Strategies
- Open a FREE Trading Account
- Read our latest reviews on: Avatrade, Exness, HFM and XM
Related Articles


Sidebar rates
Related Posts
