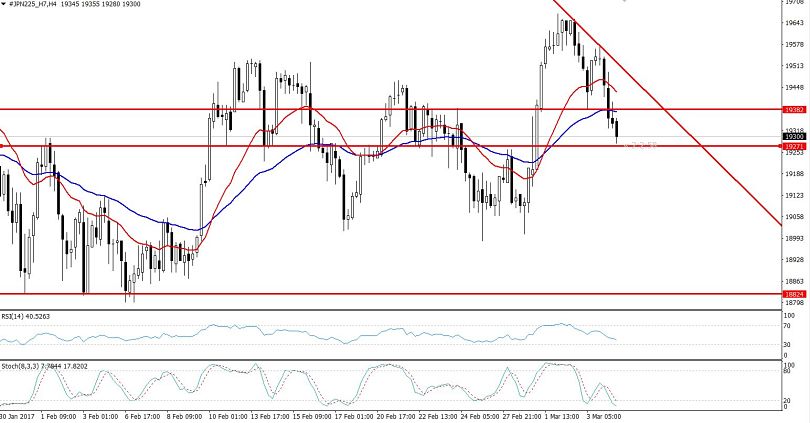
Three Black Crows in the Nikkei, What Does That Mean?
Today in the early European session, the global stock market indices are trading bearish due to several fundamentals, such as the renewed interest rate hike sentiments from the Fed Chair Janet Yellen, unfavorable growth figures from the world's 2nd largest economy, China, and lastly, mounting geopolitical anxieties in Asia after the North Korea fired four ballistic missiles early today, hiking the tensions between China and South Korea..
The Japanese stock market index, Nikkei, helped us secure more than 40 green pips this morning along with the WTI Crude Oil that gave us 18 pips. The Nikkei has a strong positive correlation with the U.S stock markets, including DJIA and S&P500. It mostly follows these indices and gives us clues from a trading point of view. We can see that the S&P 500 has fallen around -0.34%, whereas the Nikkei has fallen -0.46% to trade at 19,379.14. In addition, the U.S fundamentals also influence the Japanese Index.

Technical Outlook of Nikkei
The Japanese Stock Index, Nikkei, broke out of an ascending triangle pattern in the 1-hour timeframe after violating a major support level of $19380. The index is likely to hold below this support and become a resistance level. Further, we can see the candlestick pattern “three black crows” that indicated a potential reversal in the bullish trend. Lastly, the leading indicator RSI has also entered into the oversold territory, signaling that buyers are looming around the area.
Fellows, we can have a buying position above $19282 with a stop loss below $19275 and a take profit around $19375.
- Check out our free forex signals
- Follow the top economic events on FX Leaders economic calendar
- Trade better, discover more Forex Trading Strategies
- Open a FREE Trading Account