First Week of April – Top Economic Events To Watch
Welcome to another great month, traders. Last week, most figures remained positive but didn't suceed in having a major impact on the market. We are anticipating a calm week ahead. The explaination for this is in our previous weekly forecast entitled 8 Major Things To Watch Out For This Week.
The Week Ahead – What To Look For?
The first week of April has ample trading opportunities for us. The calendar is showing some major macroeconomic factors. Simply put, it’s an NFP (non-farm payroll) week guys, and I'm really excited for the upcoming trade opportunities. Let me help you understand the major market events so you can plan your trades accordingly. Good luck!
Structure of the Report
I'm dividing this report into two sections. In the first section, we will get to know the major upcoming fundamental events. The second section will contain the technical outlook for major currencies and commodities.
Section 1 – Top Economic Events To Watch This Week
USD
- ISM manufacturing index (Monday – 15:00)
- ADP Non-Farm Employment Change (Wednesday – 13:15)
- Federal Reserve FOMC Minutes (Wednesday – 19:00)
- Unemployment Claims (Thursday – 13:30)
- Employment Report (Friday – 13:30)
AUD
- Cash Rate (Tuesday – 5:30)
- RBA Rate Statement (Tuesday – 5:30)
- RBA Gov Lowe Speaks (Tuesday – 10:15)
CAD
- Trade Balance (Tuesday – 13:30)
- Employment Report (Friday – 13:30)
EUR
- Spanish Manufacturing PMI (Monday – 8:15)
- Spanish Unemployment Change (Tuesday – 8:00)
- German Factory Orders m/m (Thursday – 7:00)
- ECB Monetary Policy Meeting Accounts (Thursday – 12:30)
GBP
- Manufacturing PMI (Monday – 9:30)
- Construction PMI (Tuesday – 9:30)
- Services PMI (Wednesday – 9:30)
- Halifax HPI m/m (Friday – 8:30)
President Trump – Chinese President Xi Jinping Meeting
On the 6th – 7th of April, U.S President Donald Trump is due to meet with Chinese President Xi Jinping in Florida. They are likely to discuss bilateral trade and security issues, including North Korea and the South China Sea.
The market is likely to pay attention to speeches from Federal Reserve officials, though the speeches generally only have a muted impact on the prices. In addition to this, we have to keep a close eye on global developments, particularly the outcomes of U.K Article 50 as well as the French Presidential election in the 4th week of April.
Section 2 – Technical Outlook
Now, let us discuss the technical side of currencies and commodities. In this section, we are going to share the major trading levels, patterns and trade opportunities for the week.
EUR/USD – Welcome Back Home
Last week the EUR/USD traded perfectly, as predicted in our previous weekly outlook report. At the start of the week, the EUR/USD gained after the fail of the health care bill, which increased concerns over whether the Trump administration would succeed in implementing tax reforms. However, the gains were limited, as the pair dropped dramatically due to uncertainties caused by the Article 50.
ECB Monetary Policy Meeting – My Sentiment
This week, there is an ECB Monetary Policy Meeting accounts which is due to be released on Tuesday. But the question is, is this an important event?
In short, yes. It has the potential to shake the EUR/USD and give a new trend. In my opinion, considering the improvements in inflation and labor market figures, we can expect a hawkish tone in the ECB Monetary Policy Meeting Accounts.
 EURUSD – Daily Chart
 EURUSD – Daily Chart
Technical Outlook – Weekly
Let's begin by having a look at the weekly timeframe where we see a "bearish engulfing" candlestick. It is signaling a strong bearish sentiment on the part of investors. We can also see "three black crows" followed by a bullish momentum, which demonstrates a fresh bearish wave is likely to come.
However, now it is trading on a 50 periods EMA which is extending a support around $1.0650. Quite interestingly, the EUR/USD has just completed a 61.8% Fibonacci retracement at $1.0650. This could be a coincidence, but this coincidence has the potential to weaken the impact of bearish candlestick patterns.
This week, the EUR/ USD will follow macroeconomic events in deciding it's next direction. However, the pair can find resistance at $1.0715 & $1.0820, while finding support at $1.0650 & $1.0570.
GBP/ USD – Still a Celebrity?
Nope, in the world of forex the GBP/USD is no longer a celebrity, especially considering the muted response of investors towards Article 50. Over the previous week, the Sterling remained in the spotlight due to Article 50. However, the volatility remained lower as most of the event was already priced in. Let's move to the technical chart.
GBPUSD – Daily Chart
 GBPUSD – Daily Chart
Technical Outlook – Weekly
Though the fundamentals are being bearish, the technical side is demonstrating a strong bullish bias. This is particularly true given the strong bullish close on Friday along with the upward crossover in the RSI (at 60) and the prices holding above 50 periods EMA. Our all-technical friends are suggesting a buy.
At this moment, the pair is trading at $1.2523, right below an ascending trendline resistance level of $1.2590- $1.2600. Buying opportunity remains above this level with a potential target level of $1.2650 and $1.2735. Whereas, below $1.2600, we can see further selling until $1.2470 and $1.2400. In addition, $1.2340 is a very significant support level.
USD/JPY – The Sellers Favorite
Once again, the Japanese Yen remains an attractive currency due to the global uncertainties in the U.S, Eurozone and the U.K. Traders simply sell a pair whenever they feel uncertainty and confused about events happening in that particular area's market.
Just like last week, we don't see any major economic events coming from the Japanese economy. We have to depend on technical analysis to trade the USD/JPY.
USDJPY – Daily Chart
 USDJPY – Daily Chart
Technical Outlook – Weekly
We have discussed $111.750 level a lot in the previous week. Specifically, this level gave us some good trades on a buying side, while later on it worked as a strong resistance.
Looking at the daily chart, even the strong bullish engulfing candle failed to violate this major trading level. At the moment, the USD/JPY is holding at $111.350, below 50 periods EMA. The leading indicator RSI (at 40) is signaling a bearish bias.
Also, we can't ignore the descending triangle pattern in the daily chart. If the fundamentals remain in favor, we can capture nearly 350 pips on a selling side. Below $111.750, the pair's next target is likely to be $109.850 and $107.750.
WTI Crude Oil – The Bulls Taking Control
Last week, the Crude oil extended gains lead by speculation that members of OPEC, the Organization of the Petroleum Exporting Countries, are conspiring to prolong production cuts for a longer period than initially planned.
The optimistic GDP figures from the United States, the world's top oil consumer, underpinned the prices and short sellers backed out over concerns that the U.S economy is back on track and may trigger a high demand for oil in future.
WTI Crude Oil – 4 Hours Chart
 WTI Crude Oil – 4 Hours Chart
Technical Outlook- Weekly
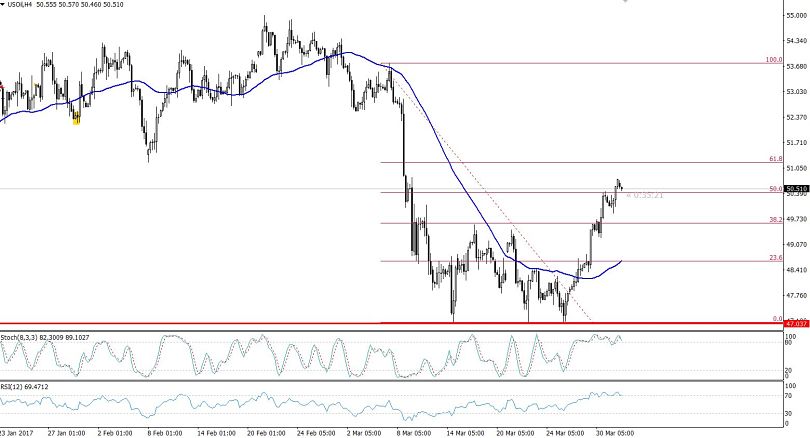
In the daily chart, we see that the WTI Crude oil has completed the 50% retracement at $50.35 and now is holding right above this level at $50.52. Considering the bullish power, we can expect further upside movement until the 61.8% Fibonacci level of $51.20. The oil has also formed an upward channel in the 4 – hour chart.
More importantly, we can see a bullish engulfing candlestick in the weekly chart. The bullish engulfing demonstrates investors buying sentiment. Hence, considering the technicals, we can look for buying positions above $50.35, with a target of $50.70 & $51.20.
Conclusion
Fellows, this week is extremely important from a trading perspective. Being an intraday trader, we need to level in order to avoid sudden changes in the trends upon the release of any major economic event. Most investors are waiting for Friday to trade the U.S non-farm employment change and the unemployment rates from the United States.
Keep following us for the latest updates on the market!
- Check out our free forex signals
- Follow the top economic events on FX Leaders economic calendar
- Trade better, discover more Forex Trading Strategies
- Open a FREE Trading Account
- Read our latest reviews on: Avatrade, Exness, HFM and XM
Related Articles
Sidebar rates
Related Posts
