GBP/USD Back At The Top Of The Range – Who Wants To Short Here?
Earlier this morning, we posted a market update with support & resistance levels for USD/JPY and GBP/USD. We had mentioned there that GBP/USD has been trading in a tight range for the last 5-6 trading days.
In fact, that range is turning into a wedge/triangle now because the top of the range is moving lower, albeit very slowly. In the first few days, the range was about 80-90 pips, and now the range is just about 60 pips.
At the end of that market update, we highlighted a few trade ideas in USD/JPY. Right now this forex pair is knocking on the resistance, so if you´re trading this pair this would be a good time to look for a small short.
Anyway, back to GBP/USD – this pair is near resistance as well. We touched the upper trend line about an hour ago and the trendline rejected the price firmly.
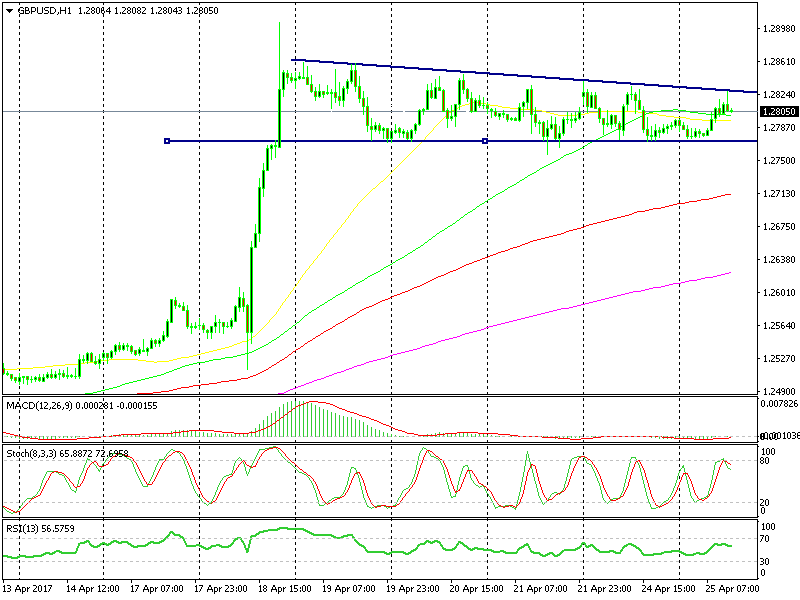 The wedge in GBP/USD is very clear right now
The last candlestick closed as a reverse hammer which is a bearish signal. This adds to other bearish signals such as the range, the resistance on top which is moving lower and stochastic indicator being oversold on H1 forex chart.
This makes four technical indicators signaling a sell forex trade up here. We might open a sell forex signal right now, although I´d prefer to wait for another try at the upside around 1.2825-30, so we would have a better risk/reward ratio.
- Check out our free forex signals
- Follow the top economic events on FX Leaders economic calendar
- Trade better, discover more Forex Trading Strategies
- Open a FREE Trading Account


