Contradicting Signals On Different NZD/USD Charts
Yesterday we opened a buy forex signal in NZD/USD and we posted an update about it. At the time of that update, our signal was looking a bit dodgy since we were about 20 pips in the red. Now, this signal looks a lot better and we are around the opening levels.
Although, as the title suggests, we´re receiving contradicting signals from the H1 and H4 forex charts.
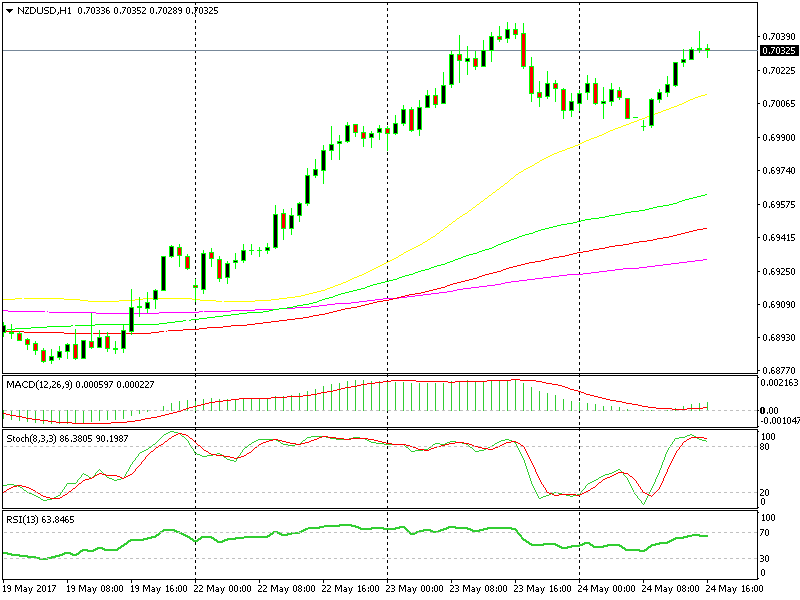
Looking at the hourly chart, we see three technical indicators pointing down.
 Can you spot 3 bearish indicators?
1 – The previous hourly candlestick closed as an upside down pin, which is a reversing signal;
2 – The 0.7045-50 area is a resistance level since it is the highest price in the last 2 months;
3 – The technical indicators at the bottom of the chart (stochastic and RSI) are overbought and headed down;
So, the hourly chart is pointing down but the trend is still up; let´s see if the trend can beat the other indicators.
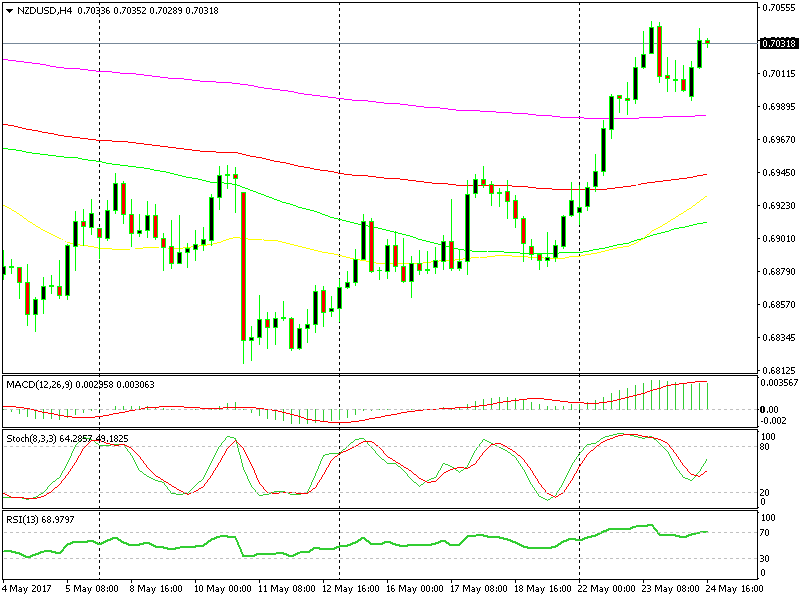
Although, if we switch to the H4 chart we see that the picture is completely different. The stochastic indicator is headed up and there´s plenty of room to run higher. Besides that, the momentum and the trend are obviously up, and we have 2-3 indicators pointing up in this timeframe chart.
 The H4 chart is pointing up though
You never know how a forex trade will end up going, but I have a little more faith on the H4 chart. Let´s hope the bigger timeframe chart takes the upper hand and we end up with another winning signal.
- Check out our free forex signals
- Follow the top economic events on FX Leaders economic calendar
- Trade better, discover more Forex Trading Strategies
- Open a FREE Trading Account


