EUR/USD – Will The 50 SMA Support Our Buy Signal?
In our last forex update, we highlighted the support and resistance levels for EUR/USD. We are just above a strong support area, so who wants to give it a try?
For starters, the trend is massively upward. Yellen´s comments gave the Buck another blow, so the USD is on the defensive, even against the Yen which took a beating in the last month.
Second, this area around 1.1380-1.14, is a pretty strong support level. It´s been supporting the price all week, with the last attempt being yesterday after Yellen.
The third technical indicator pointing upward is the 50 SMA (yellow) on the H4 forex chart, which is laying just below here. This moving average has been holding the uptrend in place despite being pierced for a short period of time during this upward move.
 Support looks solid at the 50 SMA
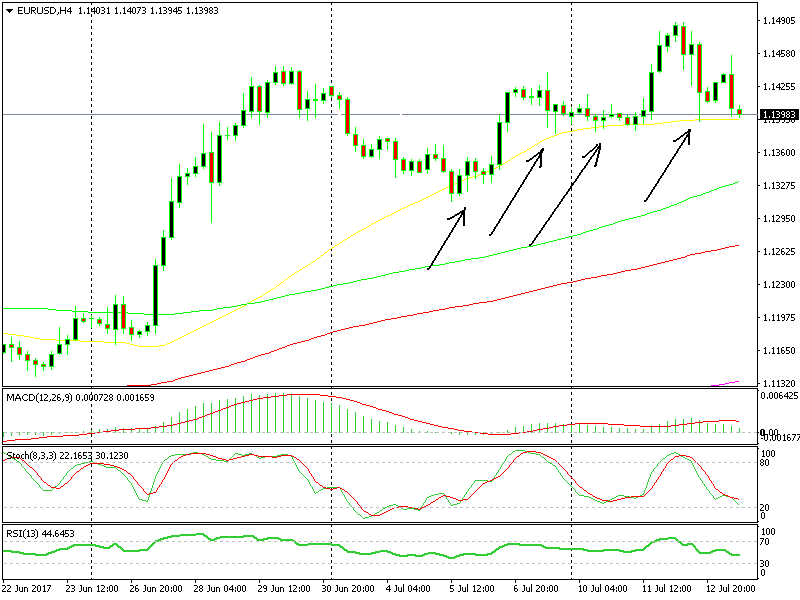
Last but no least, the stochastic indicator has almost reached the oversold area and RSI is getting there too. This means that the pullback lower has run its course and the uptrend is likely to resume.
So, four technical indicators pointing up are more than enough for a forex trade. But again, we´ll follow the price action to get the best possible entry price.
- Check out our free forex signals
- Follow the top economic events on FX Leaders economic calendar
- Trade better, discover more Forex Trading Strategies
- Open a FREE Trading Account


