Forex Signals US Session Brief, August 2nd – The Market Is Waiting For A Sign
UK Economy Is Back In Doldrums, But Theresa May Still Pursues A Hard Brexit
Yesterday, we thought that the UK economy was making a reverse after weeks of disappointing economic data. The joy at the prospect didn’t last long enough so that British PM May could shut up the soft Brexiters or anti Brexiters.
Yesterday, she was pushing further for a hard Brexit since most of her Conservative Party is turning against her. She´s trying to win support by putting her foot down for a hard Brexit which is the most unreasonable thing to do.
Life is ruthless when reality hits back. The construction sector has been the forerunner of the British economy. Even during the global financial crisis, this sector has been quite resilient, offering plenty of work for builders in the UK, half of whom are Polish, Albanian and from other Eastern European countries.
But today´s report for the construction sector puts May right back in the middle of the hungry wolf pack that is her party. Construction PMI fell to 51.9 which is close enough to contraction, so that won´t help May in her quest for isolation.

If you are waiting for a sign today to pick a direction, this is not the day
Feeling Like Opening A Long Term Sell Signal In GBP/USD?
GBP/USD has been climbing higher over the last several months, particularly in July. However, when compared to other pairs, the climb doesn’t seem so impressive. EUR/USD has gained more than 12 cents in the last few months, while the Canadian Dollar has gained about 14 cents against the Buck during this period.
Although, most of these gains were made due to the sick and weak dollar. Once the dollar finds some solid ground, GBP/USD is likely to be the first major pair to turn back down, especially if the economic data from the UK continues to be horrible and May sticks to her hard Brexit stance.
According to the technical analysis, this forex pair is overbought in all timeframes, there´s no doubt about it. As we mentioned in this morning´s first forex update, the 200 smooth moving average looms just above where we are now, around 1.3250-60.
Today, GBP buyers had another go at the top side but failed to reach 1.3250, so the 200 SMA on the daily forex chart is providing resistance.
Both technical and fundamental analyses suggest that a reverse is due, but we have to figure out exactly when it will happen. If you want to go short right now, you better place the stop loss above 1.35, with TP1 above 1.30 and TP2 around 1.28. Risk/reward (R/R) ratio is pretty good, although, remember the timing.
Are US ADP Non-Farm Payrolls Providing Direction?
ADP non-farm employment change figures were released just now and at first glance, it looks like a negative reading since the number is red.
Well; the actual number was slightly lower than expected, however, last month´s number was revised more than 30k higher, which is a big deal. They should balance each other out on paper, but in reality, this should be positive for the Buck, because it is a slight indicator that the US non-farm payrolls on Friday might offer a positive surprise as well.
GBP/USD jumped about 20 pips higher after the release, so I started getting worried that the market might be misreading the numbers. It is reversing though and is now back down to where it was before the release, so our forex signal here is close to hitting take profit. Counter trending works well sometimes if you know how to play it and if you are patient enough.
USD/JPY & USD/CHF Making A Violent Pullback, Is Market Reversing?
USD/JPY has been the ultimate selling pair over the last three weeks and we have made a few pips from this pair. We have opened several sell forex signals here in the last three weeks, and they have closed in profit.
Yesterday, this pair briefly broke below 1.10. Nevertheless, that looked dodgy to me since it couldn’t stay below that level for too long. Even the H1 candlestick couldn’t close below that level.

The 50 SMA looks to be providing resistance on the H4 chart
This morning I woke up to see this forex pair around 1.11, which is 10 pips higher. That´s exactly the case when big players breach an important level to trigger weak stops below it, only to reverse back higher in no time.
I´m not saying that the recent trend has changed, but the market sentiment might have shifted since the Swissy is losing considerable ground as well. It looks like safe haven currencies are not very in demand today.
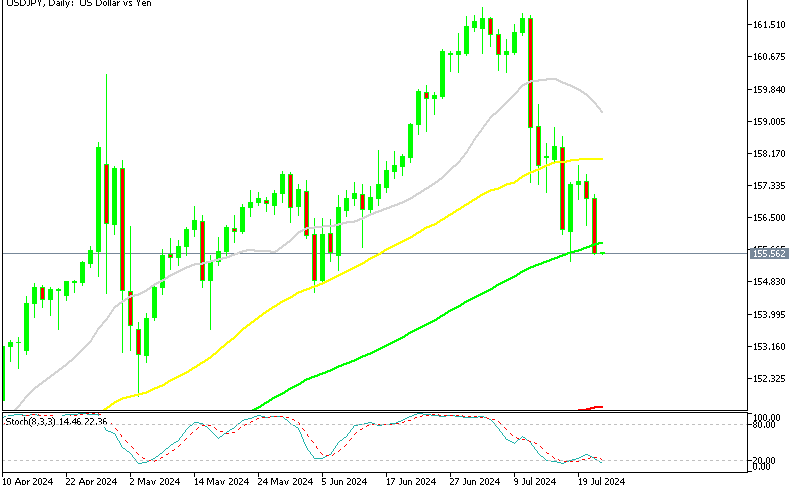
Technically, selling USD/JPY makes sense since the H4 chart is overbought and whenever stochastic was overbought on this time frame chart during these past three weeks, the downtrend resumed.
So, we might as well open a short term sell signal here, targeting 30-50 pips, with a stop above the 50 SMA (yellow), but we have to be careful just in case the market sentiment has changed for real.
So, this is it for the midday brief guys, but keep an eye out for the US oil inventories in a couple of hours, because they are likely to have an impact on oil prices and consequently on the Canadian Dollar.


