Dec 18 – A Good Day to Trade The Ranges, Thin Volatility Ahead!
Good morning, traders.
Last week, the FX Leaders team helped investors make some nice profits. This week, trading activities could remain quiet as most of the investors are already on holiday. This may cause the volatility and trading volume to remain light. However, we can trade the ranges this week. Let’s take a look at today’s top economic events…
Top Economic Events Today
Great Britain Pound – GBP
CBI Industrial Order Expectations – At 11:00 (GMT), the Confederation of British Industry will release the UK’s industrial order expectations. This is a leading indicator of economic health. The businesses react quickly to market conditions, and changes in their expectations can be an early signal of future economic activity such as spending, hiring, and investment.
Historically, this figure has failed to make a big impact on the market, and I’m expecting the same today.
Eurozone – EUR
Final CPI y/y is due to be released at 10:00 (GMT) with a slight neutral forecast of 1.5% vs. 1.5% in the last month. This is the change in the price of goods and services purchased by consumers. The increased inflation is considered good for economy and currency as it puts pressure on central banks to hike the interest rates.
Top Trade Setups
USD/JPY – Bullish Trendline Support
Last week, the Japanese Yen strengthened upon the release of Japanese Tankan Index. The US dollar trend is still not clear as it’s trading sideways due to lack of trading volume in the market.

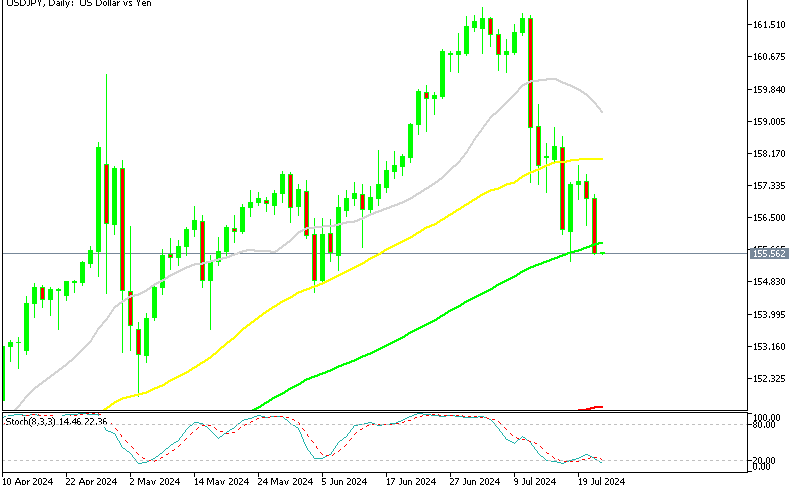
USD/JPY – Daily Chart
The RSI and Stochastics are coming out of the overbought zone. On the daily chart, the pair formed a bullish engulfing candlesticks pattern which gave us technical reason to stay bullish. Now, the bullish pattern is getting stronger. Especially, if the USD/JPY completes another bullish candle on the daily chat.
Besides this, the bullish trendline is supporting the pair at $112 and the pair is likely to pull back upward from this level.
USD/JPY – Key Trading Levels
Support Resistance
112.16 112.87
111.74 113.16
111.45 113.58
Key Trading Level: 112.45
USD/JPY Trading Plan
I’m looking to stay in sell below $112.85 with a stop above $113.250 and take profit at $112.250 and $111.850.
USD/CAD – Triple Top & Ascending Triangle Pattern
The Loonie is at a standstill since the BOC (Bank of Canada) decided to keep the interest rates on hold at 1%. At the moment, the pair has formed an ascending triangle pattern which is proving a solid resistance to the pair at $1.2895. USD/CAD has tested the same level three times now, thus making it a triple top pattern. We have another opportunity to short the pair for a few pips.
USD/CAD – Daily Chart
Since ascending triangle patterns are meant to break upward, we can go long as it may help us capture 100+ pips.
USD/CAD- Key Trading Levels
Support Resistance
1.2774 1.2929
1.2679 1.2989
1.2619 1.3084
Key Trading Level: 1.2834
USD/CAD Trade Plan
Let’s keep an eye on $1.2835 to stay bullish. Above this, we can take a buy entry with a target of $1.2890. Good luck and trade with care!


