Buying USD/CAD at Old Support/Resistance Area


The US Dollar is having another tough day at the office. It started last night after the USD opened with a gap higher but quickly closed that gap when the market reversed and the Tokyo session started. I didn’t see any results that might be responsible for this latest USD weakness. That does, however, open a few trades for us, such as the one we just took in USD/CAD.
The hourly chart below shows that the USD/CAD has been trading in an uptrend this month. It completed two bullish moves and currently in a retracement mode.
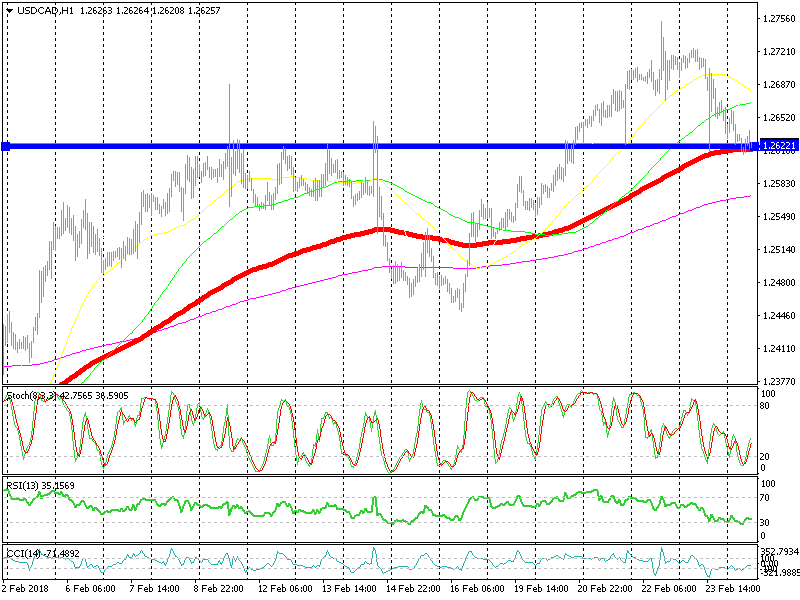
USD/CAD now turning bullish after the retrace lower
There are a few technical indicators pointing upward for the USD/CAD. Firstly, this area around 1.2620 is a major support and resistance area. It provided resistance many times this month, broke to the upside last week then turned into support.
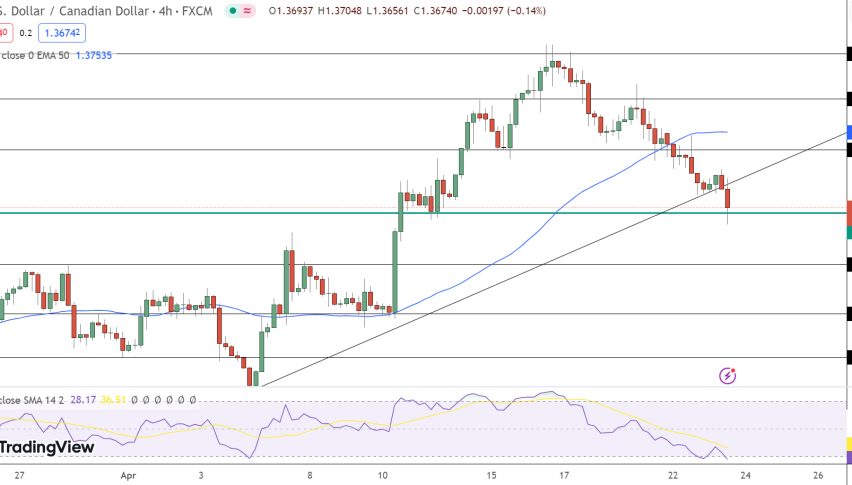
The 100 SMA (red) has caught up with the price now and is adding extra strength to this level. Switching to the H4 chart, you can see that the 50 SMA is approaching pretty quickly thus strengthen the moving average of this support level even further.
The H1 and H4 charts are oversold and riding up, as stochastic indicates. This forex signal looks great as we are a couple of PIPs in profit.