Gold Edges Down Ahead of U.S. Inflation – What to Expect?
On Wednesday, the market exactly traded in line with our forecast entitled Gold Depressed Around $1305. The volatility remains in check during the Asian and European session as most of the European markets are closed in the observance of Ascension Day. But trading gold during the U.S. session will be fun as markets may get volatile on the release of U.S. CPI data.
Recalling FX Leaders May 10 – Economic Events Brief, the Bureau of Labor Statistics will be releasing the consumer price index data at 12:30 (GMT). The U.S. inflation is expected to gain 0.3% vs. -0.1% in April. Whereas, the Core CPI m/m is expected to gain 0.2%.

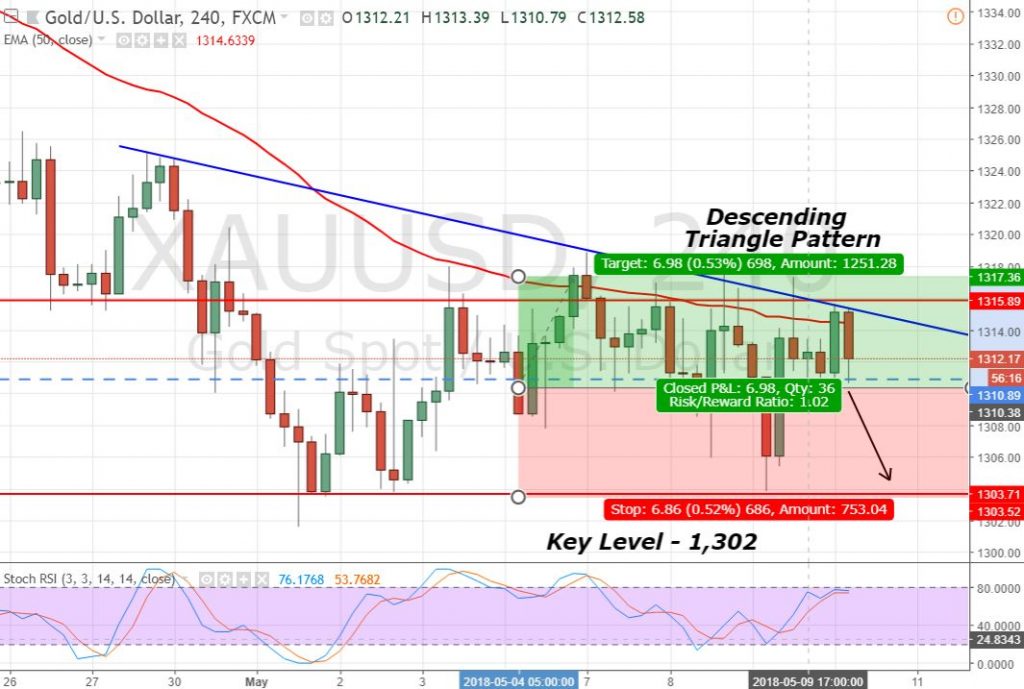
Gold 4- Hour Chart
The thing is, there’s a negative correlation between gold and the U.S. dollar. Therefore, better than expected, inflation is likely to drive bearish waves in gold. Perhaps, that’s the reason, we are seeing fewer fluctuations in gold.
The technical side hasn’t changed much. On the 4- hour chart, you can see a descending triangle setup that we spotted yesterday and is still valid. This setup is likely to provide a strong support to gold near $1,303 along with a resistance at $1,316. But at the moment, the immediate support prevails at $1,311 and the violation of this can push gold towards $1302.
Gold – XAU/USD – Trading Plan
The idea is to stay bullish above $1,311 with a stop below $1,309 to target $1,315. Whereas, I will be looking for a sell position below $1,311 today. Good luck!


