USD/CAD Targeting 1.25 After Making A Bearish Reversal at 1.30


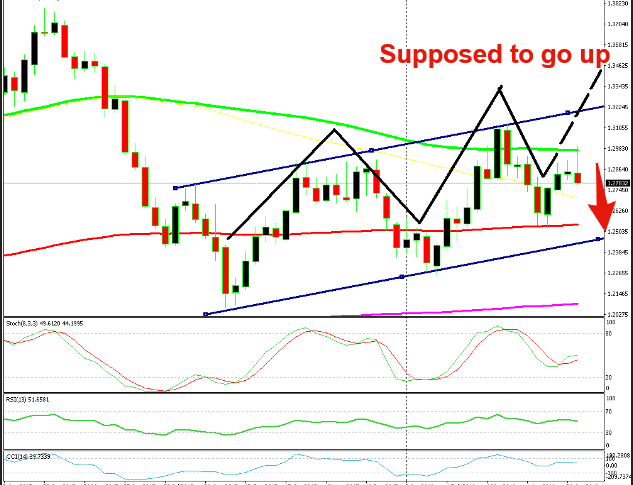
USD/CAD has been in some sort of an uptrend since September last year. It has been following an upward channel for 8 months, but now the moving average is taking over the trend. This forex pair has entered between the 100 simple MA (green) at the bottom and the 100 smooth MA (red) at the top and has moved out of the range a couple of times, above and below. But now, it seems like the price is respecting the two moving averages instead of the trend.
According to the trend trading strategies, USD/CAD should move above the 100 SMA (red) and target 1.33. But it seems as if this pair has forgotten about the trend now and is trading moving averages instead.
Several weeks ago, the price stopped right at the 100 smooth MA (red) after the bearish leg. It should have reached the bottom line of the uptrend channel, but it stopped right at that moving average. That was a sign that the trend was becoming less important and the moving averages were taking over.
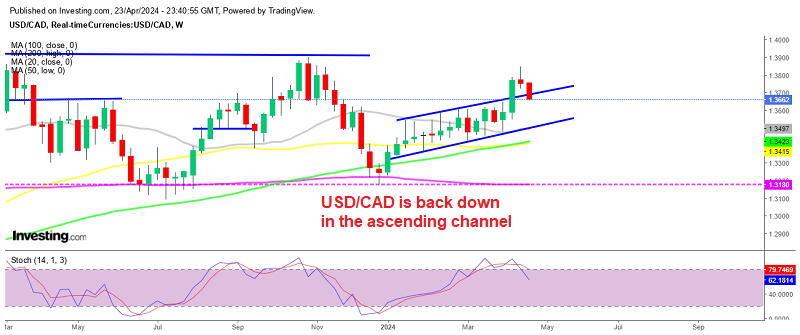
As you can see from the weekly USD/CAD chart now, the upside leg of the uptrend should have reached the top line of the range, but again, it reversed right at the 100 simple MA (green). Another factor played a role in the latest bearish reverse that is unfolding now, the major resistance level at 1.30. This level was broken in March, but the price dived back below and it seems that it has returned as a major level now, aided by the 100 SMA (green) of course.
The candlesticks are also pointing down. Last week’s candlestick closed as a doji which is a reversing signal. This week’s candlestick looks bearish as well. So, it seems like USD/CAD is entering the bearish phase now. Oil prices are on the climb again which is helping the CAD, since Canada is a major producer and exporter of crude Oil, so everything points down for this pair now.
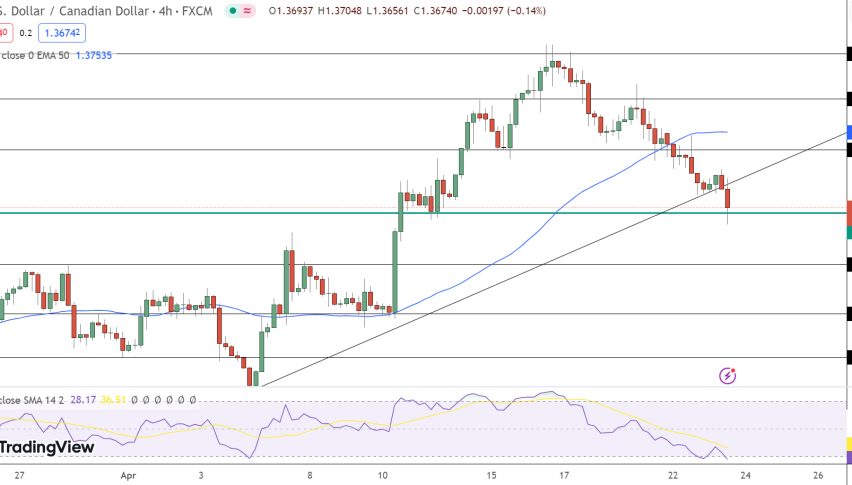
We are a bit late to enter this forex trade because USD/CAD is more than 200 pips off the highs now. But, this is how this pair looks right now and if we get a chance to enter a bit higher, we might just do so. The daily chart is finding some support at the 100 SMA, so perhaps we see a pullback higher to 1.2850s where we might be persuaded to go short.