Getting Ready to Sell GBP/USD as the UK Inflation Takes Yet Another Dive
GBP/USD has been in a steep downtrend for more than a month now. The softening economy and inflation are weighing on the GBP
GBP/USD has been in a steep downtrend for more than a month now. Part of the reason for this strong bearish move has been the softening British economy and part of it has been due to softening inflation numbers. Three months ago inflation was at around 3% in the UK and the Bank of England (BOE) was about to hike the interest rates because of it.
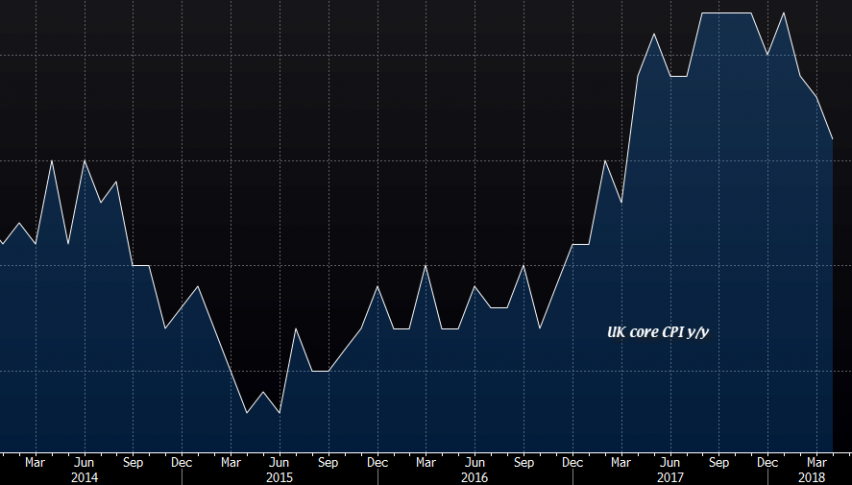
But, inflation started taking a bearish turn in March slipping lower to 2.7%. In April we saw another slide to 2.5% while now the main year/year CPI (consumer price index) number comes at 2.4% against the expected 2.5%.
The monthly CPI number was expected at 0.5% but the actual number came at 0.4%, so that was disappointing too. The yearly core inflation also slipped lower, from 2.3% last month to 2.1% this time.
A swan dive like this is a really bearish sign
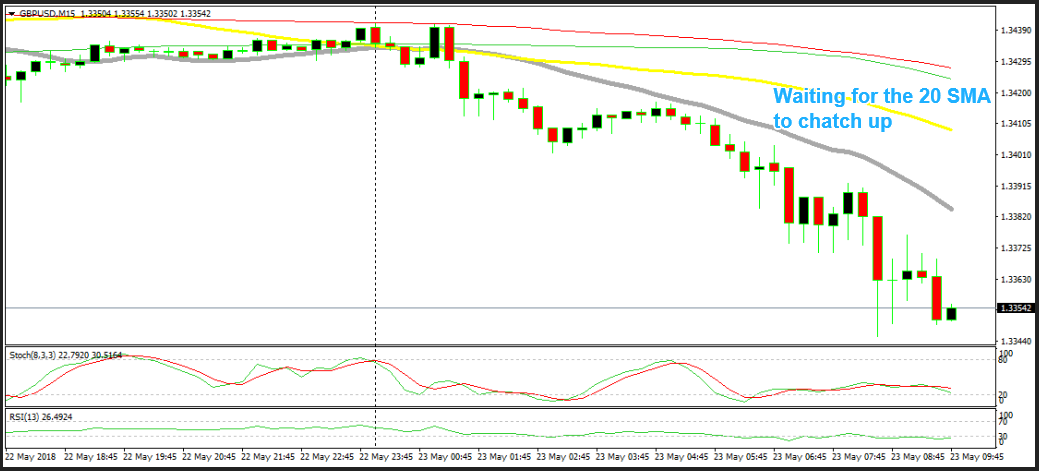
GBP/USD took another dive, losing 50 pips after the inflation report was released. This pair is about 150 pips lower from the highs yesterday, so it has been one rollercoaster of a ride. Although it has been like this in all financial markets in the last two days, it is very difficult to trade.
Although, I’m waiting for a pullback higher to sell. I’m not waiting for anything big, just a retrace higher on the 15-minute chart, probably to the 20 SMA (green).
- Check out our free forex signals
- Follow the top economic events on FX Leaders economic calendar
- Trade better, discover more Forex Trading Strategies
- Open a FREE Trading Account
- Read our latest reviews on: Avatrade, Exness, HFM and XM
Related Articles


Sidebar rates
Related Posts
