Gold Facing the 50 SMA Again on H4 Chart As USD Recovers
Last week we saw Gold turn bullish. In fact, this turnaround looked more like a retrace before the next move lower and that’s what is going

Gold (XAU) made a comeback last week after having declined for nearly a month in a straight line. Actually, Gold has been on a downtrend over the last two months, but during the last several weeks, the decline has been pretty straightforward with little to no bounces.
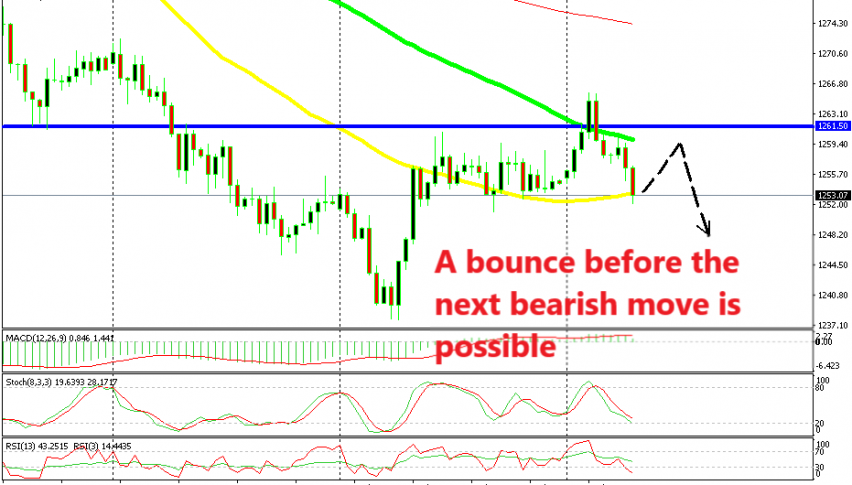
Although, last week we saw Gold turn bullish. In fact, this turnaround looked more like a retrace before the next move lower and that’s what is going on in Gold. I posted an article yesterday about Gold where I highlighted the 50 SMA (yellow) on the H4 chart and the 100 SMA (green) as Gold was trading between these two moving averages.
Gold was having some trouble pushing above the 100 SMA since the area around it had provided support and resistance previously. Gold buyers managed to push above the 100 SMA eventually, but they couldn’t keep it up there for too long. The USD buyers returned in the afternoon and Gold reversed back down.
Now, we are back at the 50 SMA which is providing some form of support. It has been pierced a few times, but the price is still too close to the 50 SMA, so this moving average is not broken yet. It provided solid support to Gold last week after being broken, so it is likely that it does the same now again.
The stochastic indicator is almost oversold, so the move down looks exhausted for now. Perhaps, we will see a move higher to the 100 SMA before the next bearish move which will likely break the 50 SMA for good. If I see Gold back up at the 100 SMA, then I might be persuaded to open a sell trade.
- Check out our free forex signals
- Follow the top economic events on FX Leaders economic calendar
- Trade better, discover more Forex Trading Strategies
- Open a FREE Trading Account


