Bitcoin Completes the Elliot Wave Pattern, but the Retrace Stalls at the 100 SMA
Bitcoin has made quite a comeback this month. In fact, the bullish reversal started at the end of last month after Bitcoin failed to make new lows. Fundamentals surely helped as Bitcoin has become more acceptable in the real world.
So, Bitcoin completed the first bullish wave at the end of last month and the beginning of this month. After that, Bitcoin retraced lower, but turned bullish again by the middle of July and completed the second bullish wave.
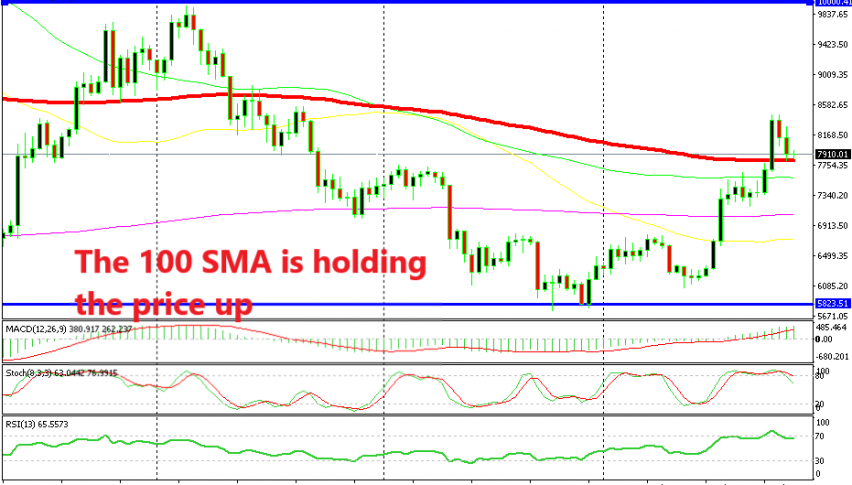
The third bullish wave took place last week. This completes the Elliott Wave Pattern which includes three bullish waves and two bearish retracing moves. In the last two days, Bitcoin has slipped lower but the sellers are having trouble breaking the 100 SMA (red) on the daily chart.
The stochastic indicator is heading down and is a long way from being oversold, so the retrace lower is far from being complete on the daily timeframe. But, the trend has changed and often the bullish moves begin before retraces are complete. Besides, the 100 SMA is holding strong. This moving average stands at $7,800.

Stochastic is oversold on the H4 chart and the 50 SMA is approaching fast
If you switch to the H4 chart, you can see that Bitcoin is oversold here and the 50 SMA (yellow) stands at $7,700. The area around this level was the high last week, which might turn into support now. So, I think I will wait until today closes to see if the sellers will have another try at the downside.
The current price action surely tells us so. If that happens and the 50 SMA holds on the H4 chart, then we might be persuaded to go long tomorrow. By that time, the stochastic will be much closer to oversold levels on the daily chart, which will be a stronger signal to go long.


