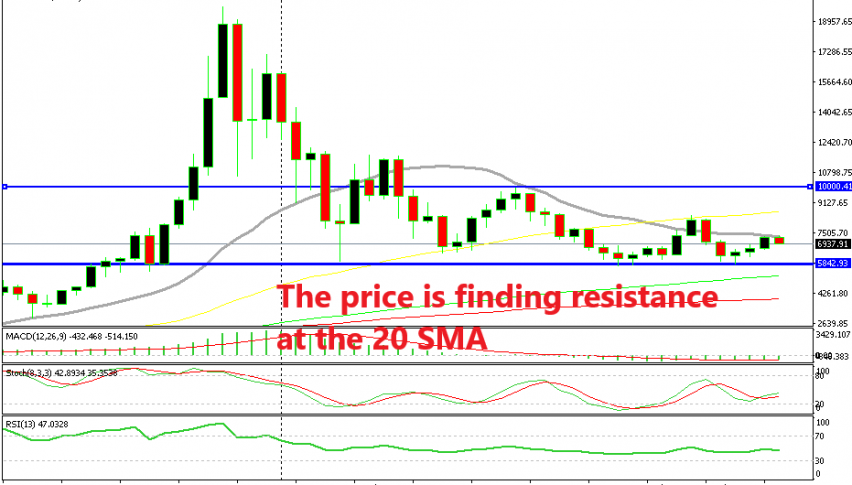
Bitcoin started to reverse about three weeks ago when it reached the bottom of the range. It bounced off the support level at around $5,850 and since then we have seen a slow crawl and the formation of an uptrend during these last three weeks.
Looking at the weekly chart above, we see that the uptrend has been forming in the last three weeks after the price formed a doji at the bottom of the range. The next two weekly candlesticks are pretty bullish. But, Bitcoin has just taken a dive in the last two hours, which is threatening the trend.
Bitcoin has just lost around $400. The bearish reverse today started right below the 20 SMA (grey) on the weekly chart, which makes you think that this might be a technical move, but I doubt that.

The trend has been broken but the 200 SMA is still holding on
Looking at the h4 Bitcoin chart above, we see that the 20 SMA (grey) and the 50 SMA (yellow) which have been keeping the uptrend in place during this time, have now both been broken. But at least the 200 SMA (purple) is still holding the line. It seems like a fundamental event has hit Bitcoin, but I can’t see anything at the moment. If I find where this move is coming from, I will let you know guys.


