USD/JPY Playing the Range Perfectly Between Two Moving Averages
USD/JPY is trading in a range between two MAs. We traded the range yesterday and might do so again today.
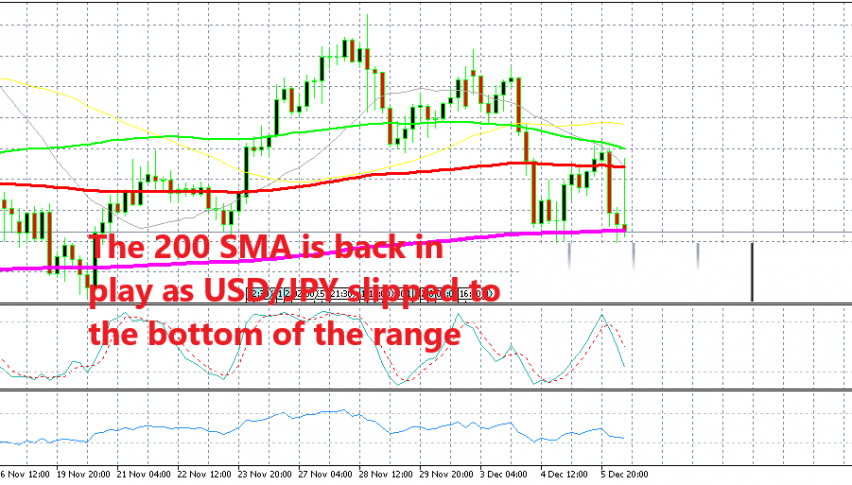
Yesterday we posted a forex update on USD/JPY. We took into analysis the H4 chart. This forex pair had found support at the 200 SMA (purple) on this time-frame chart during the decline and it was finding resistance at the top when we posted that update at the 100 smooth MA (red).
So, we defined a range for this pair between these two moving averages as you can see from the H4 chart above. Considering the range, we opened a sell signal at the 100 simple MA. The price broke above the 100 smooth MA briefly but the other moving averages that were standing above provided resistance and the price reversed back down, so we booked profit on our signal overnight.
This morning, I see that the extremes of the range have been in play all night long, as well as this morning. The price bounced off the lows early this morning but returned back down pretty quickly. Now the price is at the bottom of the range again at the 200 SMA (purple), but as I said, the bearish reversal happened quite fast.
The sentiment improved early in the morning as market fears receded on upbeat trade comments. But not, we see that this pair has dived back down. So, I’m holding on for now, since the trend is still bearish for this pair. Although, if the price doesn’t break the 200 SMA soon, then we might be persuaded to go long on this pair.
- Check out our free forex signals
- Follow the top economic events on FX Leaders economic calendar
- Trade better, discover more Forex Trading Strategies
- Open a FREE Trading Account
- Read our latest reviews on: Avatrade, Exness, HFM and XM
Related Articles


Sidebar rates
Related Posts
