Trying to Trade the Range Between Two MAs in Nikkei Trading
Stock markets have been retracing higher for several days, but Nikkei might have reached its limits now.
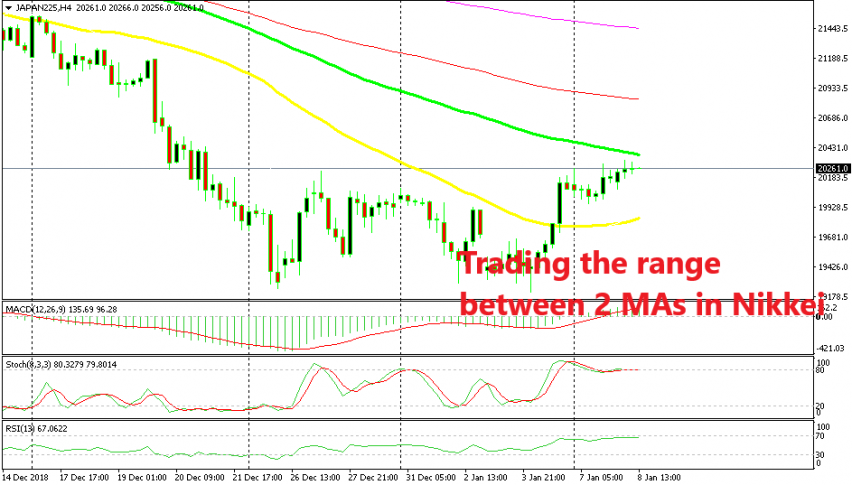
Stock markets have been climbing higher as the new year got underway last Wednesday, after a major bearish trend in the second half of last year. Nikkei has climbed around 1,000 points higher during this time, but the major trend still remains bearish, therefore we are thinking of using this opportunity to go short on Nikkei. In fact, I just went short right now with a forex signal so let’s see what we are trading here.
Well, the 50 SMA (yellow) has been broken on the H4 chart and now Nikkei is heading for the 100 SMA (green). This moving average has provided support and resistance before, so it should be a big obstacle for buyers. Another indicator signalling a bearish reversal can be found in the stochastic window. As you can see from the line there, there is a bearish divergence since stochastic is now lower than it was last Friday, but the price is higher. That’s a bearish divergence.
Candlesticks are also pointing to a reversal down. The last two H4 candlesticks closed as dojis which are reversing signals. Another bearish sign is the fact that other indices are slowly grinding higher again today, while Nikkei seems too exhausted, so once the climb stops in other major indices, Nikkei will be the first to turn bearish. We already sold Nikkei, now let’s hope it turns bearish soon.
- Check out our free forex signals
- Follow the top economic events on FX Leaders economic calendar
- Trade better, discover more Forex Trading Strategies
- Open a FREE Trading Account
- Read our latest reviews on: Avatrade, Exness, HFM and XM
Related Articles

Sidebar rates
Related Posts
