Gold Still Finds Solid Support at Moving Averages, but Until When?
We have covered GOLD extensively recently as it keep bouncing up and down on an ever changing sentiment in financial markets. We are short on Gold with a long term trade/signal at $1,290 so we are keeping an eye on our trade, but it has been a bit nerve wracking to see the price head lower, only to bounce back up in the next few hours as sentiment shifts.
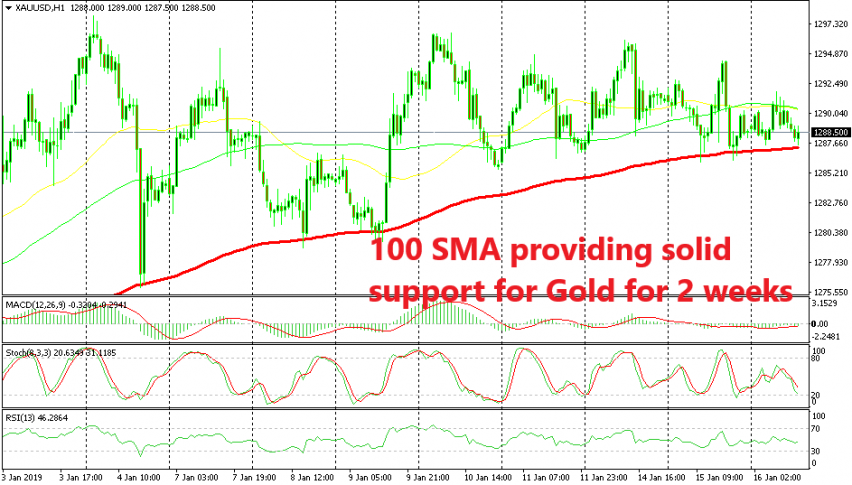
Although, another reason for the downside falling short at around $1,287 is moving averages. As you can see from the H1 chart above, Gold has tried to reverse down many times since it topped out below $1,300 early this month. But, the 100 SMA (red) has been containing the price during the dips and eventually Gold has turned back up.
This thing has happened five times in the last two weeks and today is the sixth time that Gold comes back down to this moving average. Right now the price is flirting with the 100 SMA once again. I hope today will be the day that Gold sellers will finally break below it, which would open the way for a bigger bearish move further below, but it’s a tough support indicator.

The 50 SMA is still being a thorn on the side
That moving average might have been broken actually, but the problem is that we have another moving average on another time-frame which is adding strength to that support indicator. As we pointed out yesterday, the 50 SMA (yellow) is also hanging around the same level. This moving average hasn’t worked exactly to the pip but it has provided solid support and has been pushing the price higher. So, here we are back again. Although, I have the feeling that this time might be it and we will see a break lower, but you can never be too sure in this business.


