Gold Broke Out of the Triangle, Now Let’s See if Sellers Can’t Take Out the 20 SMA
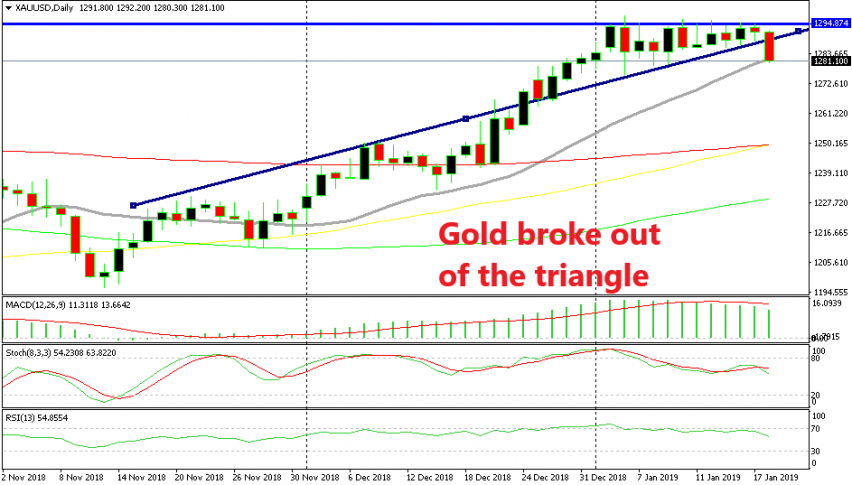
Gold has been trading in a triangle since the beginning of the year, but it broke out if it on Friday. Now it faces the 20 SMA.

GOLD has been on a bullish trend since August, which picked up pace as we approached the end of the year. It got pretty close to the big round level at $1,300 early this month/year but the buyers were unable to take that level out, so it remained unbroken as a valid resistance level or resistance zone, since this level forms a buffer zone.
After failing at resistance, Gold has been trading inside a range which then evolved into a triangle, connecting swing highs and the lows from last year to the lows this year. These triangles are bound to explode in one direction and this one did last Friday.
Sellers finally got their act together and gained confidence to push below the lower line of the triangle as sentiment improved due to news relating to Brexit and China-US trade meeting. We had a long term sell signal in Gold by the way and we closed it manually on Friday.
But now, GOLD is facing a real indicator on the daily chart. That’s the 20 SMA (grey) and it should provide some support, but let’s see. Gold closed slightly below it on Friday but that’s not a proper break. The price is still too close to that moving average, so unless bears make a clear move and push Gold considerably lower, it will not be considered broken.
What we have to watch today is if Gold will continue to slip lower, in which case, this moving average would turn to resistance. Otherwise, if the price doesn’t fall too far below it and starts reversing back up, we will see if the previous support at around $1,287 will turn into resistance.
- Check out our free forex signals
- Follow the top economic events on FX Leaders economic calendar
- Trade better, discover more Forex Trading Strategies
- Open a FREE Trading Account


