USD/JPY Reverses at the 100 SMA but Now Faces the 50 SMA


Yesterday we went short on USD/JPY as this pair was retracing higher after turning pretty dovish last week and losing around 200 pips from top to bottom. The sentiment in financial markets turned negative last week, hence the decline. It continues to be so this week too, although not as much as last week.
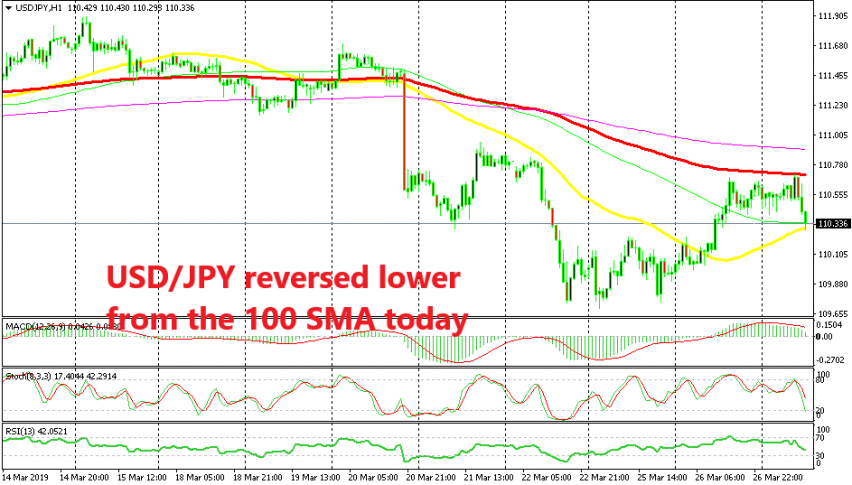
We decided to go short at the 100 simple MA (green) yesterday on the H1 chart. The H1 and H4 time-frame charts were overbought, so we decided to sell USD/JPY, thinking that the pullback higher was complete. But, the buyers pushed higher and the price got close to the 100 smooth MA (red).
The buyers have tried to push above this moving average since the US session started yesterday but they haven’t been able to break above it. If the price can’t go up, it will go down eventually – that’s one of the main rules in forex. So, we see that the buyers gave up at the 10 SMA around 110.70 and now the price is heading lower.
But, we are facing the 50 SMA (yellow) on the H1 chart as you can see above, so it’s going to be a bit of a struggle here. We are in profit with our trade but this pair needs to decline further so the price can reach our take profit target. If the 50 SMA breaks soon, then chances are that our signal will hit take profit, otherwise, we might see a reversal higher. So, we wait and watch for now.