US WTI Crude Oil Forming a Triangle Between the 50 SMA and the Resistance Level
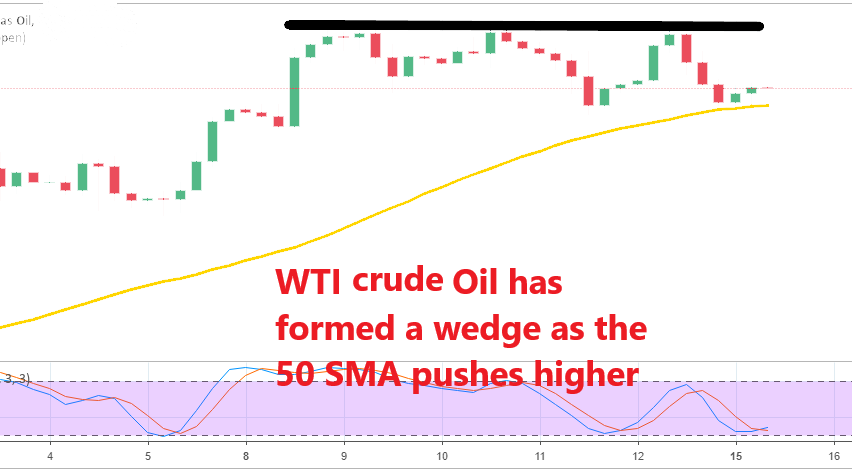
US WTI Crude has formed a strong resistance at $65.50, but the 50 SMA is pushing the price higher at the bottom side
The direction in Oil prices has been pretty clear since they made a reversal at the end of December after OPEC+ decided to keep production in check. The resistance levels have been breaking quite easily with the first level at $50, then the $55 level, the $60 and the $63 levels, and now we see that another resistance has formed for US WTI crude at $65.50-60.
This level has been the high last week and it has provided resistance throughout the week. The buyers have reversed their trades three times at this level last week which makes it the ultimate resistance level. But, sellers have not taken advantage of that and they look pretty weak as well.
The dips have been quite shallow which means that the buyers are still in control. Now the 50 SMA (yellow) has caught up with the price and it is providing support for US WTI crude. The price bounced slightly off this moving average and is now climbing higher.
This picture shows us that a wedge has formed and it will likely evolve into a triangle. Triangles point to a break on either side, but the pressure here remains on the top side. Although it remains to be seen which side will give in first, buying at the 50 SMA and targeting the resistance looks like a sensible trade.
- Check out our free forex signals
- Follow the top economic events on FX Leaders economic calendar
- Trade better, discover more Forex Trading Strategies
- Open a FREE Trading Account


