Weekly Crypto Roundup

The market recovered quite nicely from its previous retracement of more than 27 percent the previous week, gaining nearly 24 percent during last week. However, Bitcoin remains almost 17 percent under its previous high at $13,873 with currently sitting at $11,540. Let’s find out where Bitcoin and the cryptocurrencies market are heading next by looking at the technical analysis of Bitcoin, Ethereum, the total crypto market and Ripple.
BTC/USD WEEKLY CHART
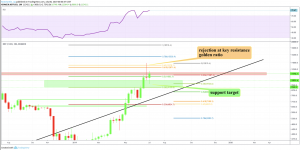
When looking at the weekly chart, Bitcoin looks quite bullish. Although the extremely high RSI indicates a sell-off soon enough, Bitcoin bounced perfectly off our previous indicated support zone, at the 0.382 fib level.
However, Bitcoin is currently fighting with the resistance at $11,760 and in order for Bitcoin to re-test the $14,000 mark, it needs to break the resistance first. In case of bearish rejection, Bitcoin finds multiple support between $8,400 and $11,000. Even a retracement down to $6,845 at the golden ratio would still remain bullish, as long as Bitcoin holds above this level.
However, it is very unlikely that Bitcoin reaches as low as that and for now, it seems likely that Bitcoin holds above $8,400-$9,000.
BTC/USD DAILY CHART
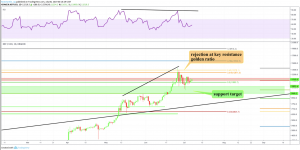
The daily chart, however, indicates an upcoming correction wave towards the downside in the not-too-distant future, as the RSI shows a gigantic bearish divergence. A potential correction target of such a move could be the yearly trendline, which is located at around $7,500.
One could argue though that the market already retraced 25 percent since the RSI showed a bearish divergence. Therefore a continuation of the correction would be wrong to assume. Another argument to support a bullish scenario is the fact that Bitcoin stopped to perform a lower low, although it had a series of lower highs and lower lows. With it currently forming a higher high, Bitcoin could go for a higher high. This would result in a break of the resistance and would consequently lead to a re-test of the $14,000 mark.
ETH/USD DAILY CHART
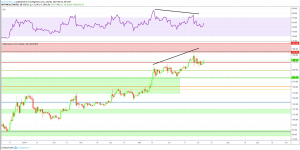
The daily RSI of Ethereum shows a bearish divergence as well, which indicates a sell-off very soon. Ethereum is currently between a resistance and support zone. If Ethereum doesn’t manage to break the resistance between $360 – $420, it will most likely retrace down to $167 – $222, where Ethereum finds major support and the golden ratio acts as an additional key support level.
TOTAL CRYPTO MARKET CAP / USD DAILY CHART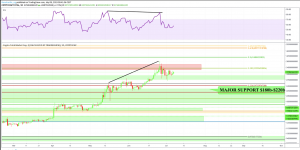
The cryptocurrencies’ market daily chart looks very much like Ethereum’s right now, as the market is between support and resistance zone and recently showed a bearish divergence in the RSI. For now, the market must break the resistance and the 0.382 fib extension level in order to go for a higher high. In case of bearish rejection, the cryptocurrency market will most likely fall down to its support range between $180b and $230b.
XRP/BTC DAILY CHART
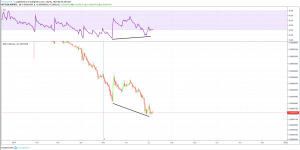
The daily chart of Ripple versus Bitcoin shows a bullish divergence in the RSI, which indicates that Ripple will either gain significantly against Bitcoin or that Bitcoin will drop significantly stronger than Ripple in price. With XRP potentially forming a double bottom right now, it seems very likely that XRP is gaining significantly in the upcoming days to weeks, which would result in an increase in the dollar price of XRP as well.
Therefore, XRP could be a very interesting buy if the market decdides to continue its uptrend.
The biggest gainers of this week were
Waltonchain, which surged by 78 percent,
Populous, which gained by 68 percent and
Realtract, which rose by an incredible 341 percent.
- Check out our free forex signals
- Follow the top economic events on FX Leaders economic calendar
- Trade better, discover more Forex Trading Strategies
- Open a FREE Trading Account
- Read our latest reviews on: Avatrade, Exness, HFM and XM
Related Articles


Sidebar rates
Related Posts
