Weekly Crypto Roundup
To find out where the market is heading next, we look at the technical analysis of Bitcoin, Ethereum, Litecoin, and Ripple.
Bitcoin finally reached its target of $14.000 and started its retracement from there, as previously assumed in the prior analysis. Ethereum also reached as high as $360 which was identified as key resistance. Since the market was trending up quite heavily, this retracement is a very healthy correction and in no way a trend switch. To find out where the market is heading next, we look at the technical analysis of Bitcoin, Ethereum, Litecoin, and Ripple.
BTC/USD DAILY CHART
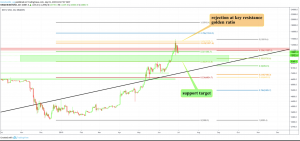
Bitcoin reached all the way up to the golden ratio Fibonacci target of $14,000 where it faced harsh rejection of 25 percent within 48 hours. For now, Bitcoin finds major support between $9,135 (0.382 fib level) and the psychological level of $10,000, where Bitcoin most likely ends its correction wave to re-test the $14,000 resistance. If Bitcoin doesn’t continue its uptrend after reaching as low as that, it can find additional support at $8,400 and between $6,800 and $7,200 where the golden ratio acts as confirmation of the bull trend. If bearishly broken, we can assume a trend switch.
ETH/USD WEEKLY CHART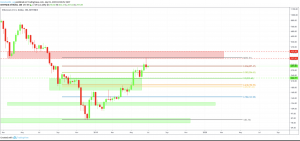
Ethereum reached our target of $360 where it faced rejection and initiated its correction wave towards $275 which resulted in a 25 percent price drop. For now, Ethereum finds two major supports at $256 (0.382 fib level) and between $180 (golden ratio) and $220, where the $200 mark acts as a psychological key level. As long as these support levels hold, the uptrend remains intact and a re-test of the $360 range is very likely to follow.
XRP shows a bullish divergence in the weekly RSI, which is extremely bullish. Additionally, XRP is currently at a very low point and there is a lot of upside potential. We could assume heavy price movements towards the upside for Ripple in the upcoming weeks.
Unfortunately, the Singapore-based cryptocurrency exchange Bitrue has suffered a major hack, losing 9.3 million XRP and 2.5 million Cardano (ADA) from its hot wallet, which resulted in a heavy sell-off of the XRP token.
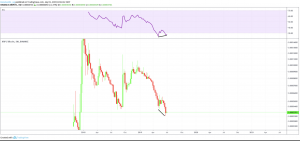
LTC/USD WEEKLY CHART
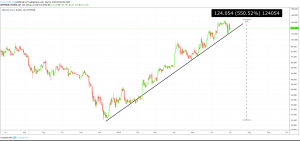
Litecoin surged 550 percent since its all-time low in December 2018. The trendline remains intact and acts as major support and with the Litecoin halving only 35 days away, we can assume a continuation of the uptrend for at least the next 14 days.
TOTAL MARKET CAP CRYPTO / USD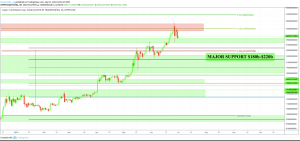
The total cryptocurrency market surpassed the resistance at $387b but quickly corrected to the downside where the $280b support held successfully so far. It seems likely that the support area between $273b holds and the market goes for a re-test of the resistance at $390b in July.
The biggest gainers of the week were
LINK, which surged by 150 percent,
QUANT, which gained by 52 percent and
REN, which rose by 58 percent.
- Check out our free forex signals
- Follow the top economic events on FX Leaders economic calendar
- Trade better, discover more Forex Trading Strategies
- Open a FREE Trading Account
- Read our latest reviews on: Avatrade, Exness, HFM and XM
Related Articles

Sidebar rates
Related Posts
