Gold Has Turned Bullish on the Monthly Chart and Pullbacks Lower Should Attracts Buyers


We have analysed GOLD many times, but the analysis has been concentrated mainly in shorter term time-frames, up to weekly. Today we will take a look at the monthly chart. On this time-frame, we see that Gold turned bearish in 2012, after it became obvious that the global economic crisis was over, which redirected investors from safe havens to risk assets.
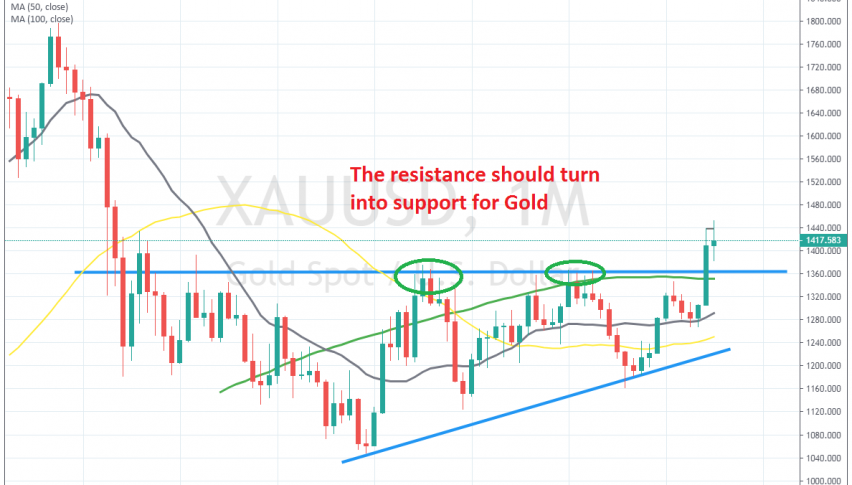
The bearish trend lost pace after the first year, but it continued to stretch further to the downside until 2016. Since then, Gold has been making higher lows, which means that the downtrend was over. But, buyers haven’t been able to make new highs, so a resistance zone formed around $1,360.
The 100 SMA (green) also helped in providing resistance at the end of 2017 and the start of 2018 as you can see form the monthly chart above. Gold approached the 100 SMA again at the beginning of this year, but it reversed below it, although that reversal didn’t last long.
Gold found support at the 20 SMA (grey) and last month it surged higher as the sentiment turned negative in financial markets again. Now the break is clear and this month looks bullish as well, so the long term trend has officially turned bullish for Gold.
Now pullbacks lower should be seen as good opportunities to sell. The previous support at $1,360 should be a good spot, since the 100 SMA also stands around there and now it should turn from resistance into support. But, we must first wait for the pullback to take place.