The 20 Daily SMA Keeps Pushing Gold Higher
The uptrend has slowed this month after the strong surge in June for Gold, but the 20 daily SMA keeps pushing the lows higher
GOLD was pretty bullish at the end of last year, spilling into the last several weeks of this year, as the global economy slowed down considerably during Q4 of 2018. But it made a reversal lower in February this year as the global economy started to improve a bit in Q1 of this year, although neither of them lasted. The rebound in the global economy faded and in Q2 manufacturing and industrial production fell in contraction in many major economies, while Gold turned bullish again by the end of May.
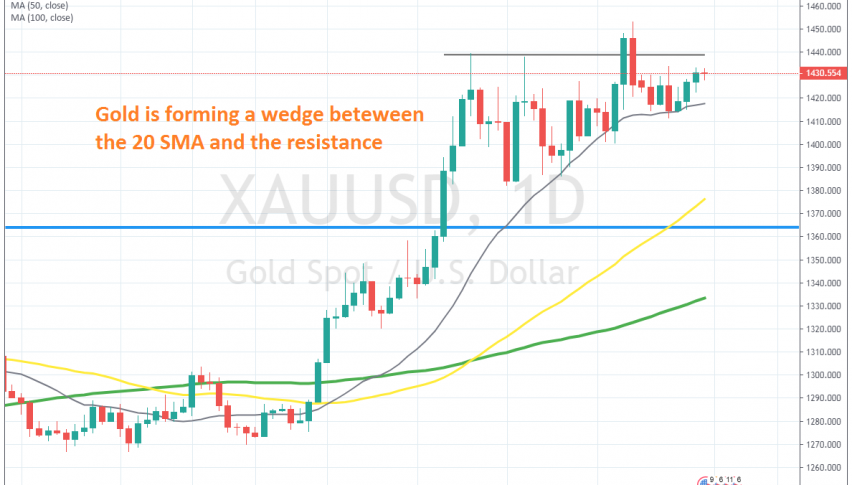
Particularly in June, we saw a big surge in Gold, shooting from around $1,280 in late May to $1,453 earlier this month. Buyers finally broke above the long term resistance level around $1,440 after failing to take it out twice in June. They pushed above that level this month, although the uptrend has lost pace.
Nonetheless, Gold has been finding solid support at the 20 SMA (grey) on the daily chart. This moving average has been providing support throughout the week and it has pushed Gold higher. The lows have been getting higher as the 20 SMA pushes up, but the new resistance still remains.
This price action is forming a triangle in Gold and triangles are bound to explode in either direction. At the end of last week we saw another pullback lower, but the 20 SMA held again and the price is climbing back up. This moving average seems like a good place to go long on Gold now, so we will try to pick a trade down there if Gold retraced down again.
- Check out our free forex signals
- Follow the top economic events on FX Leaders economic calendar
- Trade better, discover more Forex Trading Strategies
- Open a FREE Trading Account