EUR/GBP Trading Between 2 Moving Averages


EUR/GBP has been on a bullish trend for more than a month, from early May until the middle of August. During that time, this pair climbed around 850 pips. But, the trend ended as the Euro turned increasingly bearish by the middle of last month, while the GBP retraced higher.
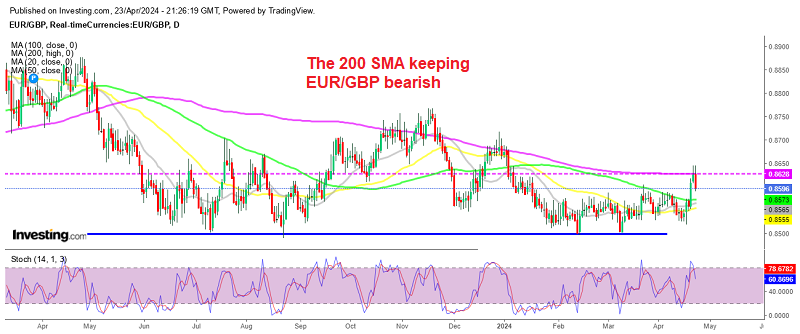
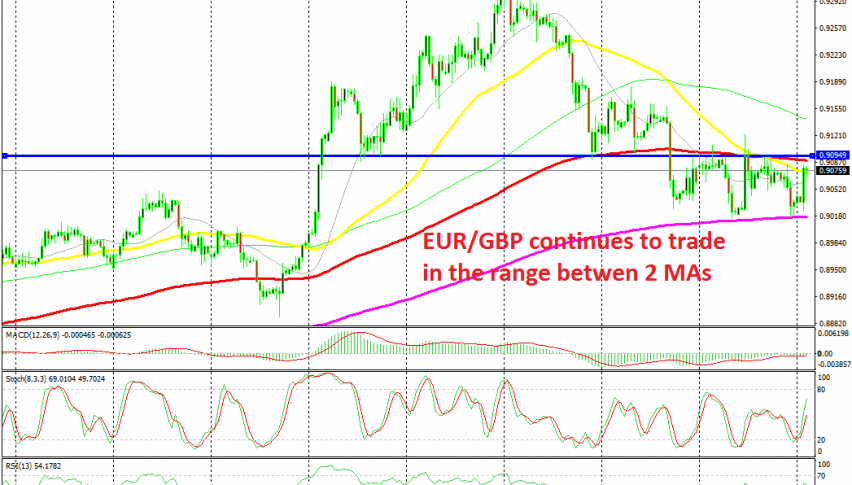
Since then EUR/GBP has lost more than 300 pips but it has failed to break below the big round level at 0.90. So it seems that this level has turned into support for this pair now. Although, the support level has been helped by the 200 SMA (purple) on the H4 time-frame chart as well.
That moving average held the declines throughout last week. the week before it was the 100 SMA (red) which was providing support. But, the 100 SMA turned into resistance after being broken, so the price has been bouncing between these two moving averages.
The 100 SMA stand just below 0.91, which seems like a good place to sell this pair since that level has been a strong resistance. the 50 SMA (yellow) caught up by with the price by the middle of last week and it helped strengthen the resistance zone. Now the price is getting closer to the resistance zone, so we are preparing to open a sell signal in this pair. The stochastic indicator is almost overbought, therefore the bullish move is coming to an end soon.