Shorting the Pullback in EUR/GBP at the 50 SMA


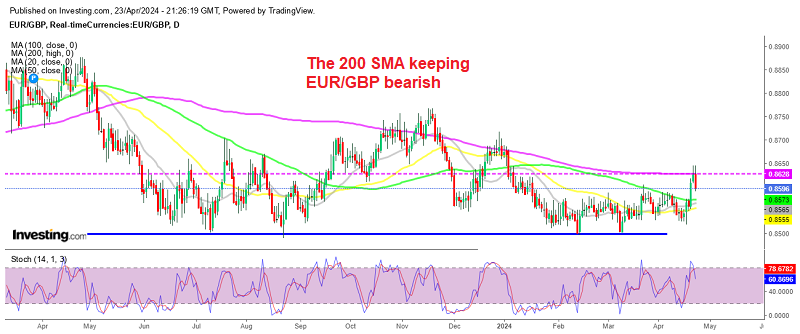
It’s been a month exactly since EUR/GBP stopped climbing and turned bearish. This forex pair turned really bullish towards the end of February and the first half of March, as the GBP crashed down, following the outbreak of coronavirus in Europe. The Euro also declined, but the impact was stronger on the GBP, which made EUR/GBP turn bearish.
The decline is not as strong as the climb, because EUR/GBP has only lost around 8 cents during the fall, while the climb was worth more than 12 cents. But, 800 pips are quite a lot as well and the pressure continues to remain on the downside.
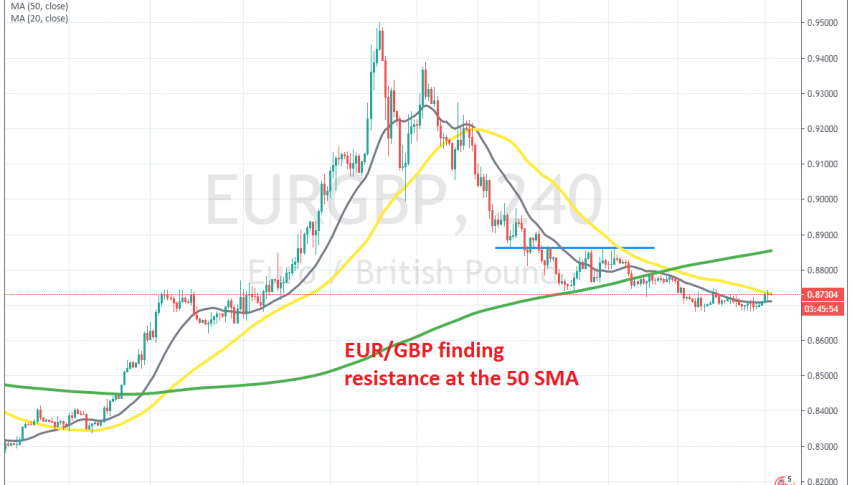
We have caught some trades in this pair during the decline and decided to take another shot at the downside again today. This pair used to find support at the 20 SMA (grey) and the 50 SMA (yellow) on the H4 chart during the climb. But these moving averages turned into resistance when the trend shifted to bearish.
Today we are seeing a pullback higher, but the 50 SMA is acting as resistance again, rejecting the price. The previous H4 candlestick closed as a doji, which is a bearish reversing signal as well, so the chart setup is pointing down for EUR/GBP. So, we opened a sell forex signal and are now waiting for the bearish trend to resume.