Crude Oil Breaks the Triangle, But Pulls Back at the 200 SMA
WTI broke above the triangle yesterday, but failed to break the 20 daily SMA
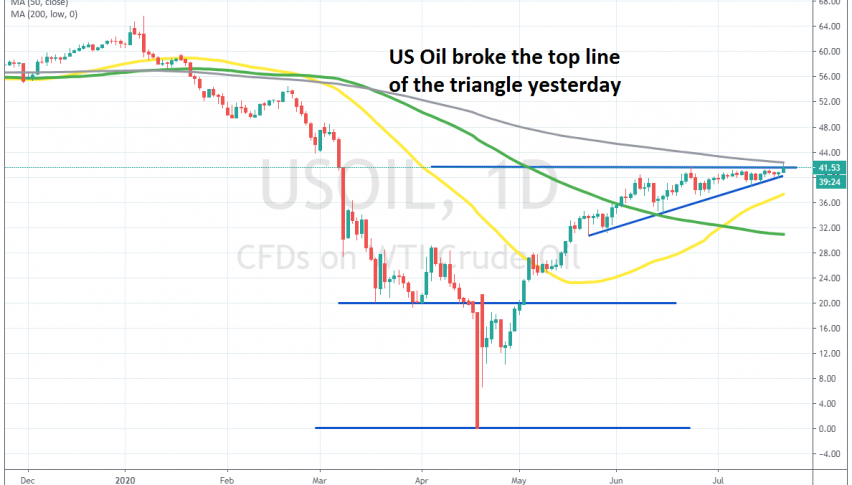
The pace of the reversal after the big crash in April in crude Oil was quite strong, with US WTI crude surging from around -$37 by the middle of April, to $28 by the beginning of May. During May, we saw another strong move to $36, but wince then the pace slowed down.
Although, lows have been getting higher constantly since mid May. An ascending trend line has formed, connecting the bottoms during pullbacks lower, while at the top the line was mainly horizontal, since buyers weren’t making new highs, despite making higher lows.
So, a wedge was forming in US WTI crude, which turned into a triangle. Triangles are bound to be broken at some point, when they reach the vertex. US WTI crude broke above the resistance level at $41.50 after news of coronavirus vaccine progress, but buyers ran into the 200 SMA (grey) on the daily chart.
Now the climb has stopped for the time being, but commodities remain bullish, with the sentiment also positive due to the above reason, as well as the EU coronavirus recovery fund, which was agreed on on Monday night at $750 billion. So, we will try to buy pullbacks, probably to the ascending trend line, which now comes at $40.50. But, let’s see when the price pulls back down there.
- Check out our free forex signals
- Follow the top economic events on FX Leaders economic calendar
- Trade better, discover more Forex Trading Strategies
- Open a FREE Trading Account
- Read our latest reviews on: Avatrade, Exness, HFM and XM
Related Articles

Sidebar rates
Related Posts
