Bitcoin Forms a Bearish Reversal Pattern, as Highs Get Lower
Bitcoin was bullish for several months, but September looks bearish so far
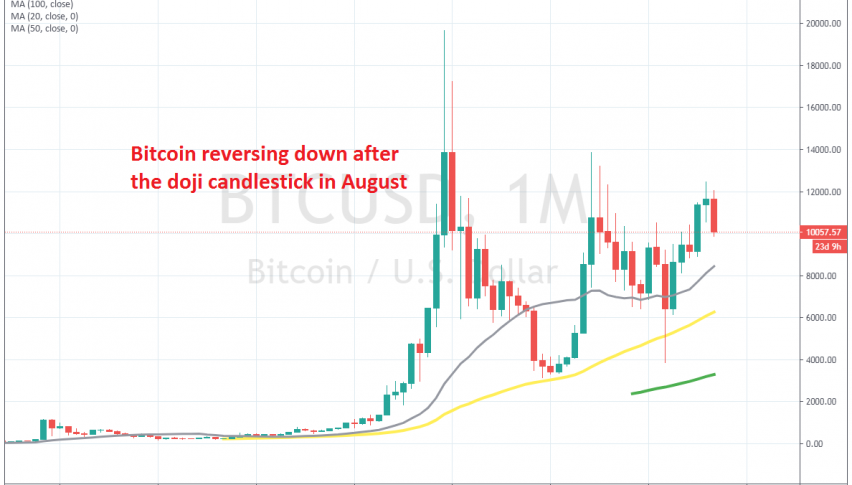
BITCOIN is in a strange situation. Overall, it surely is bullish, since it started at around $ 100-200 several years ago. Then, it surged close to $ 20,000 at the end of 2017, before pulling back below $ 3,000, and despite attempts by buyers, the highs have been getting lower.
The price reversed after the $ 6,500 dive in February and March, due to the breakout of the coronavirus, and then it climbed $ 8,500 higher, until the middle of August. But, on the monthly chart, the August candlestick closed on a bearish reversal signal, in the form of a spinning top.
The September candlestick already looks pretty bearish, with the price falling by around $ 2,000 from top to bottom. On the other hand, the lows are getting higher, as we mentioned, while the 50 SMA (yellow) is acting as support, so a wedge is forming on the monthly time-frame chart.
We will have to watch and see whether there will be a break on either side, or if the range is going to narrow, as we head into the tip of the triangle. But the sellers have run into the 20 SMA on the weekly chart now, which is providing support. If it holds, Bitcoin might make new highs and break out of the current wedge, and if not, Bitcoin will be heading towards $ 5,000.
- Check out our free forex signals
- Follow the top economic events on FX Leaders economic calendar
- Trade better, discover more Forex Trading Strategies
- Open a FREE Trading Account
- Read our latest reviews on: Avatrade, Exness, HFM and XM
Related Articles


Sidebar rates
Related Posts
