The Resistance at 0.93 Rejects the EUR/GBP Once Again
EUR/GBP pulled back last week, after failing at the resistance at 0.93
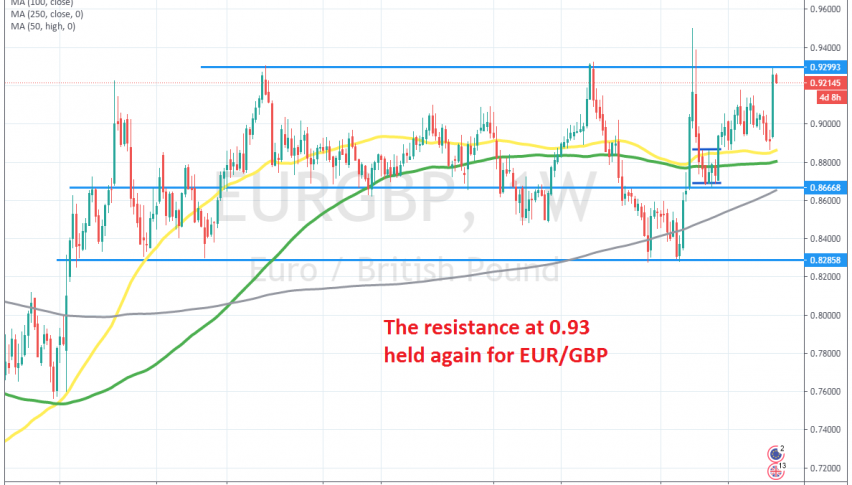
Looking at the larger period charts, we can see that the EUR/GBP has been trading sideways since 2016, when the bullish move ended. The top of the range was at 0.93, apart from March when we saw a jump to 0.95 – but that wasn’t a normal month – while the bottom came in at around 0.83.
So, the range is around 10 cents wide, although another support area has formed around 0.8660 for this pair. After the jump in March, the price retreated lower again, but it was able to make some small gains in the following months. However, in August, the EUR/GBP began retreating lower again.
But, in the first week of September, we saw the price form a doji candlestick on the weekly chart, right above the 50 SMA (yellow). That doji is a bullish reversing signal, and last week the price turned quite bullish. But the resistance level of around 0.93 held again, and buyers gave up there. Now the EUR/GBP is trading 100 pips lower, but it hasn’t pulled back too far, so buyers might have another attempt at the resistance. If they fail, we might open a long-term sell signal, after we get an idea of where Brexit stands as well.
- Check out our free forex signals
- Follow the top economic events on FX Leaders economic calendar
- Trade better, discover more Forex Trading Strategies
- Open a FREE Trading Account
- Read our latest reviews on: Avatrade, Exness, HFM and XM
Related Articles

Sidebar rates
Related Posts
