MAs Continue to Push USD/JPY Down on the Daily Chart
USD/JPY continues to slip lower and the 50 SMA has taken its turn pushing it down
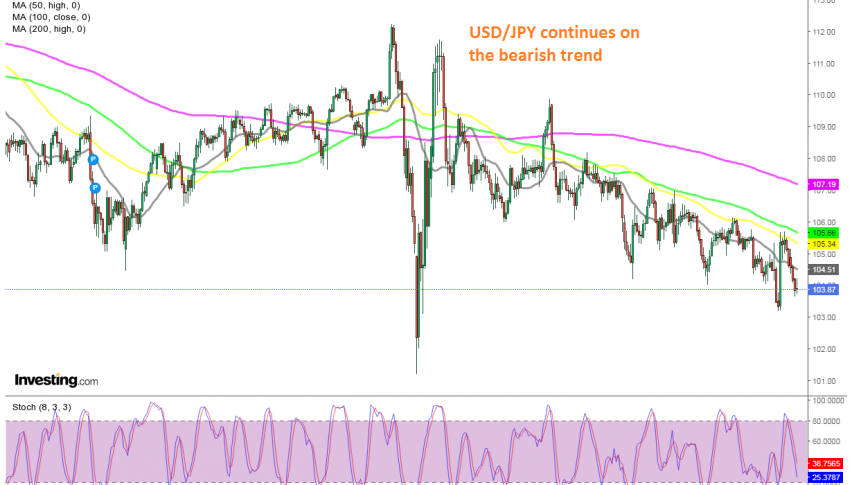
The USD/JPY has been trading on a bearish trend since 2016. There have been some decent retraces higher, such as the reversal in March, after the coronavirus crash in February. But, the long-term trend has continued its way lower, bringing us closer to the big level at 100.
In Q4 last year, we saw one of those pullbacks, when the US and China reached a trade deal, which resulted in an improved sentiment in the financial markets. That sent safe havens lower, while the USD/JPY retraced higher. After the roller-coaster ride in February and March, the bearish trend resumed again.
Since late June, moving averages have turned into resistance for this pair, as can be seen on the daily chart. The 100 SMA (green) provided resistance at first, but then the 50 SMA (yellow) took its place, as the decline moved further down. Last week, this moving average rejected the USD/JPY once again and the price has been bearish since then. We opened a sell forex signal yesterday, after a retrace higher on the H1 chart.
- Check out our free forex signals
- Follow the top economic events on FX Leaders economic calendar
- Trade better, discover more Forex Trading Strategies
- Open a FREE Trading Account
- Read our latest reviews on: Avatrade, Exness, HFM and XM
Related Articles


Sidebar rates
Related Posts
