Ripple Price Forecast: XRP Completes 50% Fibonacci Retracement, Brace for Buying!
XRP/USD closed at 1.40794 after placing a high of 1.56266 and a low of 1.16193, extending its losses and dropped for the fourth consecutive
Written by:
Arslan Butt
•
Monday, April 19, 2021
•
2 min read
•
Last updated: Monday, April 19, 2021

[[XRP/USD-sponsored]]
XRP/USD closed at 1.40794 after placing a high of 1.56266 and a low of 1.16193. XRP/USD extended its losses and dropped for the fourth consecutive session on Sunday after SEC targeted Ripple’s foreign partners. Over the weekend, a letter motion was submitted to Judge Sarah Netburn by Ripple’s lawyers claiming that the SEC was trying to obtain documents from its partners overseas. The letter suggested that the Commission had made at least 11 MoU requests to other foreign regulators requesting documents from Ripple’s foreign partners.
Ripple asserted that the SEC was trying to bully its partners into cutting ties with them and it requested the court to stop the Commission from conducting any discovery outside its jurisdiction. Ripple also accused the SEC of violating federal rules by refusing to disclose its communications with other foreign regulators fully. These developments in a lawsuit against XRP by SEC drove XRP prices on the downtrend. The losses in XRP/USD escalated further following the recent decline in the cryptocurrency market over the weekend, likely to be driven by the Turkish ban on cryptocurrency transactions.
The recent crash in the cryptocurrency market drove
BITCOIN prices below $52000 level and
ETHEREUM prices below $2000. XRP/USD also followed the market trend and fell below 1.1700 level from above 1.5000 level. Ripple prices declined by about 23.35% in just four days and reached below 1.1700 level from the highest 1.88408 level.

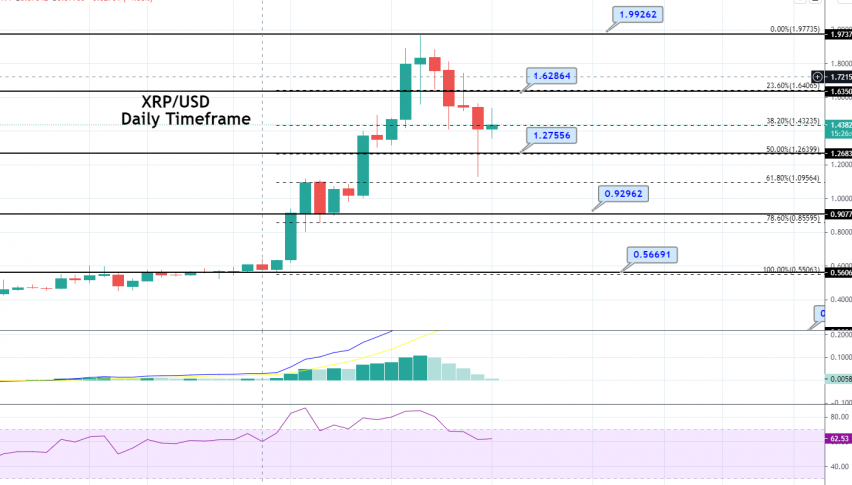
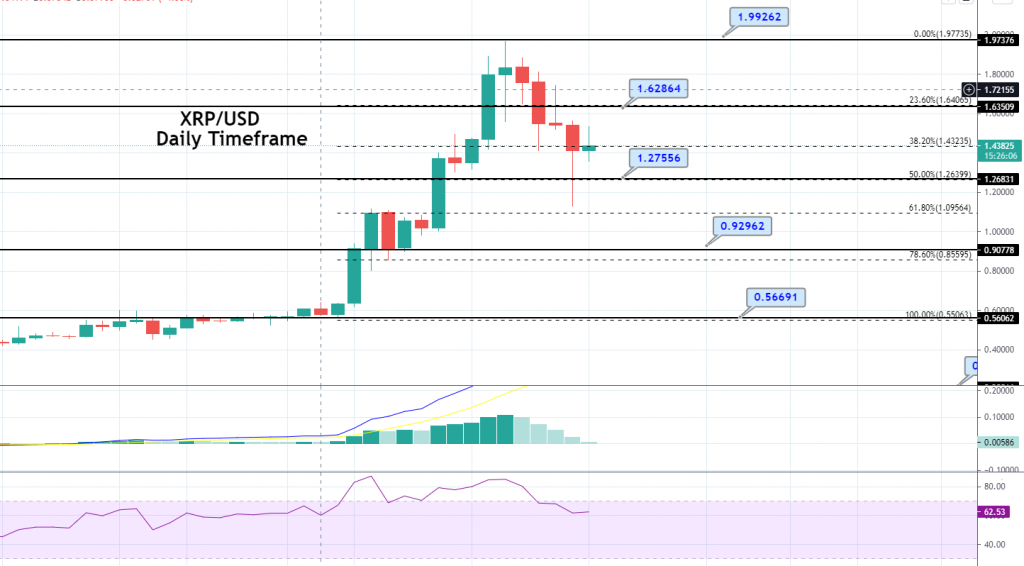
XRP/USD Daily Technical Levels
Support Resistance
1.49696 1.62757
1.45342 1.71464
1.36635 1.75818
Pivot Point: 1.58403
XRP/USD traded bearishly at 1.4416, bouncing off the 50% Fibonacci retracement of 1.2755. The pair is likely to gain support at 1.2755 level and a resistance level of 1.6286 level. The MACD and RSI are suggesting a bullish trend. The violation of the 1.2755 level can open further room for buying until 1.6286 level. At the same time, the violation of the 1.6286 level can lead the pair towards the 1.9926 level. For the moment, the idea is to hold on to the buy position over the 1.2755 level. Good luck!
Arslan Butt
Lead Markets Analyst – Multi-Asset (FX, Commodities, Crypto)
Arslan Butt serves as the Lead Commodities and Indices Analyst, bringing a wealth of expertise to the field. With an MBA in Behavioral Finance and active progress towards a Ph.D., Arslan possesses a deep understanding of market dynamics.
His professional journey includes a significant role as a senior analyst at a leading brokerage firm, complementing his extensive experience as a market analyst and day trader. Adept in educating others, Arslan has a commendable track record as an instructor and public speaker.
His incisive analyses, particularly within the realms of cryptocurrency and forex markets, are showcased across esteemed financial publications such as ForexCrunch, InsideBitcoins, and EconomyWatch, solidifying his reputation in the financial community.
Related Articles