Ripple Price Forecast: XRP Violating 50% Fibonacci Retracement, Brace for Sell!
The XRP/USD was closed at 1.30850 after placing a high of 1.48628 and a low of 1.30654. XRP/USD dropped for the 5th consecutive session on M
Written by:
Arslan Butt
•
Tuesday, April 20, 2021
•
2 min read
•
Last updated: Tuesday, April 20, 2021

XRP/USD closed at 1.30850 after placing a high of 1.48628 and a low of 1.30654. It dropped for the fifth consecutive session on Monday and extended its losses amid the ongoing lawsuit against Ripple by SEC. Many wondered if XRP would even survive when the US Securities and Exchange Commission filed legal action against Ripple Labs and its 2 top executives in December. The case was that the XRP coin was a security, and the firm behind it had raised over $1.38B through unregistered security in 2013.
After this lawsuit, many exchanges delisted XRP, and some asset managers sold their tokens. The currency also lost its place as the top three currencies by market cap and was even dropped from the top 10 list. However, Ripple’s fight against its lawsuit supported its coin spectacularly. As of mid-April, the coin has increased about 532% in just one year, and things have turned in its favor recently in the lawsuit, with the defendants prevailing in two discovery rulings. The firm also won access to the SEC‘s internal memos and minutes concerning crypto discussions.
On Monday, the Wall Street Journal editorial board criticized the US SEC to confuse its approach to cryptocurrencies. According to WSJ, the regulators created danger for retail investors, as exemplified by the SEC’s lawsuit against Ripple over its alleged issuance of native currency XRP as unregistered security. The findings in this case have highlighted the inconsistency of the SEC’s approach in not treating
ETHEREUM and
BITCOIN as securities. Despite all this positive news, XRP continued falling on Monday amid the recent market crash by declining
Bitcoin prices.
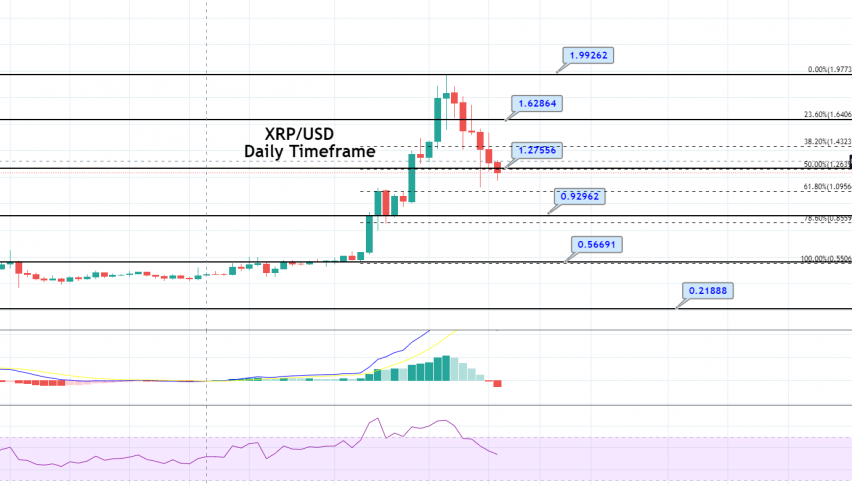
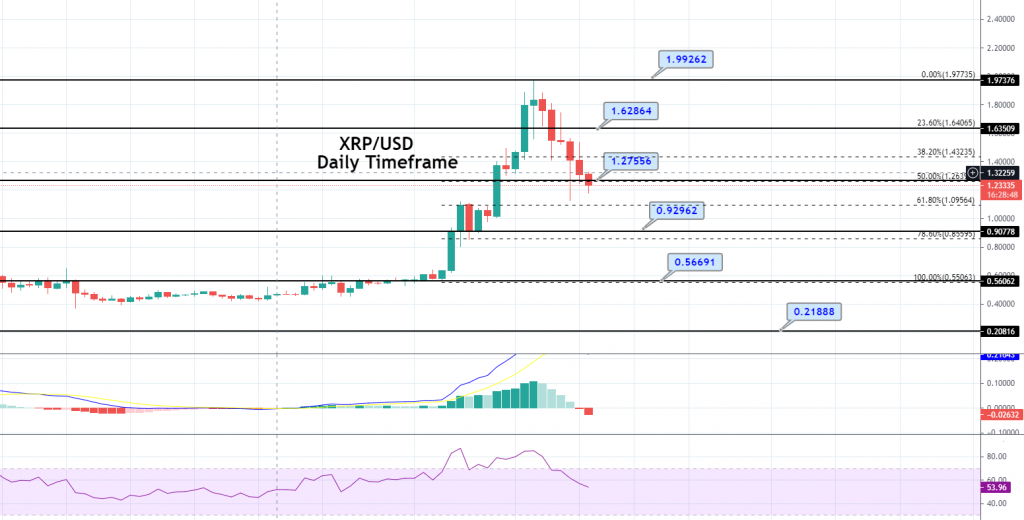
XRP/USD Daily Technical Levels
Support Resistance
1.24794 1.42768
1.18737 1.54685
1.06820 1.60742
Pivot Point; 1.36711
The
XRP/USD pair traded bearishly at 1.2278, breaking below the 50%
Fibonacci retracement of 1.2755. The pair is likely to gain next support at 1.0956 level and a
resistance level of 1.4323. The MACD and RSI are suggesting a bullish trend. The violation of the 1.2755 level is opening further room for selling until the 1.0956 level that marks 61.8% Fibonacci retracement level. Simultaneously, the violation of the 1.2755 level can lead the pair towards the 1.4323 level. For the moment, the idea is to stay bearish below the 1.2755 level. Good luck!
Arslan Butt
Lead Markets Analyst – Multi-Asset (FX, Commodities, Crypto)
Arslan Butt serves as the Lead Commodities and Indices Analyst, bringing a wealth of expertise to the field. With an MBA in Behavioral Finance and active progress towards a Ph.D., Arslan possesses a deep understanding of market dynamics.
His professional journey includes a significant role as a senior analyst at a leading brokerage firm, complementing his extensive experience as a market analyst and day trader. Adept in educating others, Arslan has a commendable track record as an instructor and public speaker.
His incisive analyses, particularly within the realms of cryptocurrency and forex markets, are showcased across esteemed financial publications such as ForexCrunch, InsideBitcoins, and EconomyWatch, solidifying his reputation in the financial community.