Polkadot Bounces Off the 100 SMA
Polkadot is bouncing again after losing nearly half its value last week
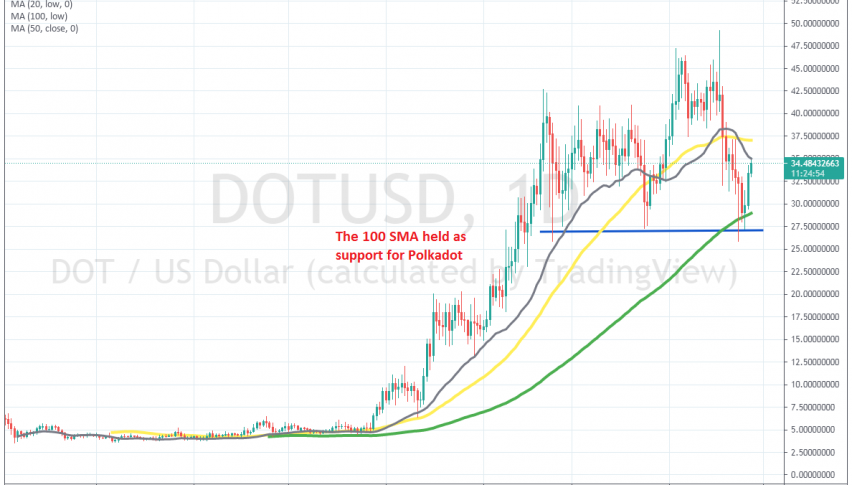
Cryptocurrencies went through a major retreat last week, probably the biggest one since the retreat in early 2008. Polkadot which started the bullish run a bit late compared to the rest of the crypto market, grew more than 10 times since late December, increasing from around $4 to $47.
DOT/USD was quite bullish this year as we explained in the 2021 forecast for this crypto, but last week’s retreat took the price around $21 lower, sending it just below $26. That means losing nearly half of its value. Sellers pushed below the 100 SMA (green) on the daily chart, but the candlesticks closed above that moving average, so there was no break of the 100 SMA.
So, this moving average turned into support, aided by the recent lows around $26-$27 and Polkadot bounced off that area yesterday, taking the price to $35. It looks like the retreat is over for DOT/USD now.
Although the 20 SMA is acting as the immediate resistance at $35, while the 50 SMA (yellow) stands ready at around $37. We are already long on other cryptocurrencies, such as Litecoin LTC and Ripple XRP, so we are exposed in this market,therefore not attempting a long on Polkadot, which we should have bought yesterday if we were to go long.
- Check out our free forex signals
- Follow the top economic events on FX Leaders economic calendar
- Trade better, discover more Forex Trading Strategies
- Open a FREE Trading Account