Polkadot Faces the Ultimate Challenge Above, As it Tries to Turn Bullish
Polkadot is trying to turn bullish, but MAs are keeping it on hold right now
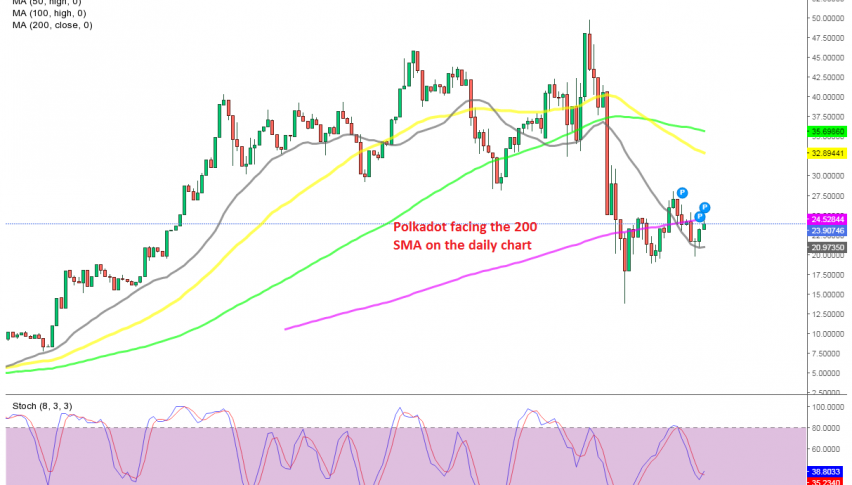
On Tuesday night we decided to open a buy signal in Polkadot, after cryptocurrencies had gone through another leg of selloff, which had sent them around 20% down. But, we saw a few signs which pointed up for this cryptocurrency, so we decided to go long in Polkadot, and the situation now seems promising.
The lows were getting higher for DOT/USD which is a bullish sign, and Tuesday’s candlestick closed as a doji, which is also a bullish sign after the decline. Besides that, the 20 SMA (gray) was acting as support on the daily chart, so there were several signals pointing up for this crypto, and we were hoping that it would resume the larger bullish trend.
We bought this pair at the 20 SMA and now we see that the price has started to bounce higher off that moving average. But buyers are facing the 200 SMA (purple) at the top now, which is the main obstacle above. If it breaks, then it will open the door for $28 to 30.

Now, the 50 SMA is acting as resistance on the H4 chart
On the H4 chart, Polkadot has been making higher lows and has moved above the 20 SMA and the 100 SMA (green). But it is facing the 50 SMA (yellow) now, and it seems like buyers are having trouble up here. There have been some doji candlesticks, which are bearish reversing signals, but we are not seeing a reversal down yet, so hopefully buyers will find the strength to push above the moving averages.
- Check out our free forex signals
- Follow the top economic events on FX Leaders economic calendar
- Trade better, discover more Forex Trading Strategies
- Open a FREE Trading Account