Nope, the Trend Hasn’t Turned Bullish Yet in Cryptos, as Bitcoin and Cardano Reverse Down Again
Cryptocurrencies are trying to turn bullish again, but the resistance zone is keeping them in check
Cryptocurrencies made a sudden reversal about two weeks ago, after being in a bearish trend for more than two months, with buyers nowhere to be seen. That improved the sentiment in the crypto market and encouraged cryptocurrency traders to buy cryptos.
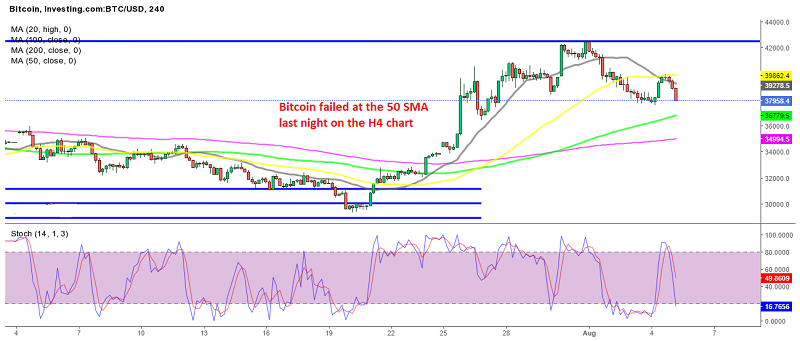
Bitcoin climbed higher, increasing from below $30,000 to above $42,000 until last Saturday, while Cardano increased from above $1 to $1.40. During the 2-week period, the smaller moving averages, such as the 20 SMA (gray) provided support for Bitcoin during the slight pullbacks lower, showing that the pace of the bullish move was quite strong.
That raised hopes that the 2 to 3 month decline in the crypto market was over and the larger bullish trend was resuming again. But, the increase stopped at the resistance zone at the top of the 3-month range for Bitcoin, at around $42,000. The price reversed and BTC/USD lost around $5,000, after the price fell below the 20 SMA (gray) and the 50 SMA (yellow) on the H4 timeframe chart.
Bitcoin Live Chart
However, yesterday we saw another reversal, this time to the upside, with Bitcoin touching $40,000. So, hopes for a big bullish reversal increased again after the quick $2,500 jump higher. But, the climb ended at the 50 SMA for Bitcoin; the price formed a doji candlestick below that moving average last night – this is a bearish reversing signal after the climb.
The stochastic indicator was overbought as well, and the reversal down came. Now Bitcoin is trading just above yesterday’s low, so the bullish trend hasn’t resumed yet. Bitcoin is still trading within the $13,000 range, as we highlighted in our 2021 Bitcoin forecast, and as long as the price fails to break out of this range to the upside, the larger bullish trend hasn’t resumed yet. So, Bitcoin buyers should trade with caution, especially near the top of the range.
Cardano Analysis – ADA/USD H4 Chart

Cardano failing to push above $1.40
Cardano also made a swift reversal two weeks ago, jumping from $1 to $1.40 in the first week. It has continued to make higher lows, as moving averages continue to hold as support during pullbacks lower on the H4 timeframe, particularly the 20 SMA (gray) and the 50 SMA (yellow).
This shows that the buying pressure is decent after pullbacks, but at the same time, ADA/USD has not been making new highs since reaching $1.40 more than a week ago. If the trend was bullish, the price would continue to new highs, which is not happening, but at the same time, the lows keep getting higher.
So, a triangle is forming between moving averages and the resistance level at $1.40 for Cardano. That suggests that a breakout to the upside will happen at some point, but for now, the larger bullish trend hasn’t yet resumed in ADA/USD either.
Cardano Live Chart
- Check out our free forex signals
- Follow the top economic events on FX Leaders economic calendar
- Trade better, discover more Forex Trading Strategies
- Open a FREE Trading Account
- Read our latest reviews on: Avatrade, Exness, HFM and XM
Related Articles

Sidebar rates
Related Posts
