Holding On to Our S&P Buy Signal, As the US Data Improves


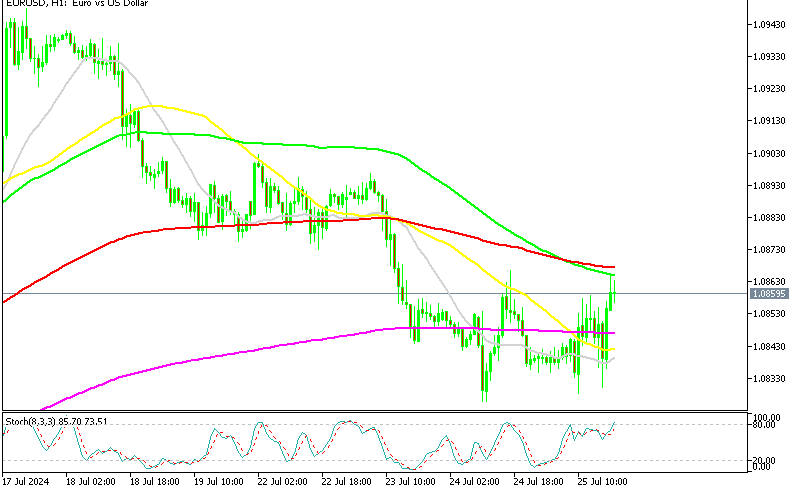
Yesterday we decided to open a trade position in the US stock index S&P500, after it had been on a retreat mode for the past week or so. The price had fallen below the 20 SMA (yellow) on the daily chart but the 50 SMA (yellow) was acting as support. This moving average has been the ultimate support for S&P and it is doing that job again, so we decided to open a buy signal.
At the end of the day, the price bounced more than 40 points higher, but today looks like another bearish day and now S&P500 is back at this moving average. The US economic data came positive for August, with the retail sales jumping after a decline in July, while expectations were for another decline and the Philly FED manufacturing index jumped higher as well.
S&P500 Live Chart
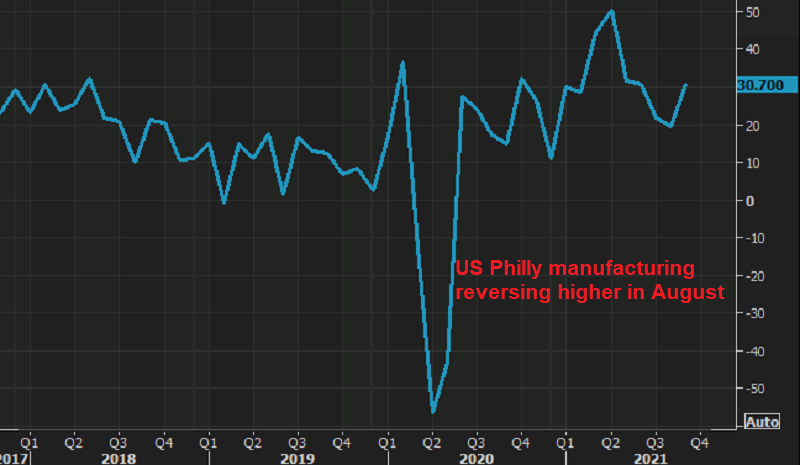
US Philadelphia FED Manufacturing Index
- September Philly Fed 30.7 points vs 18.8 expected
- August was 19.4 points
- New orders 15.9 points versus 22.8 last month
- Employment 26.3 points versus 32.6 last month
- Average workweek 20.0 points vs 20.1 last month
- Capex 23.6 points vs 33.7 prior
- Prices paid 67.3 points versus 71.2 prior
- Future activity 20.0 points vs 34.0 prior
- Full report
US August 2021 retail sales report highlights:
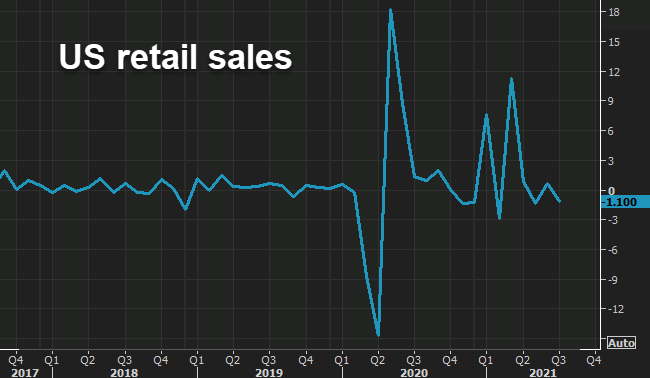
- August retail sales MoM +0.7% vs -0.8% expected
- July was -1.1% (revised to -1.8%)
- Core retail sales excluding autos +1.8% vs -0.1% expected
- July ex-autos -0.4% (revised to -1.0%)
- Retail sales control group +2.5% vs -0.1% expected
- Prior control group -1.0% (revised to -1.9%)
- Retail sales ex-autos and gas +2.0% vs -0.7% prior
- Full report (pdf)
Some key categories (m/m):
- Food services and drinking places 0.0%
- Non store retailers (online) +5.3%
- Clothing and accessories +0.1%
- Gasoline stations +0.2%
- Electronics and appliances -3.1%
- Furniture +3.7%
- Motor vehicle and parts dealers -3.6%
For some perspective, retail sales are 15.1% higher than a year ago. That’s well-above the trend and the fear is that it mean reverts. So far we’re not seeing the evidence.
US initial jobless claims and continuing claims
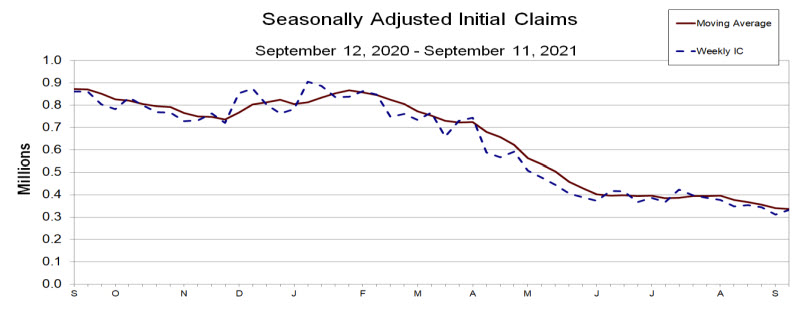
The weekly US initial jobs claims and continuing claims are showing:
- Initial jobless claims 332K versus 325K estimate
- Prior week claims were 310K
- Initial jobless claims 325K versus 325K estimate
- Four-week moving average initial jobs claims 335.75K versus 340K . This is the lowest level since March 14, 2020
- Continuing claims 2665 K versus estimate 2785K
- four week moving average continuing claims 2807.5K versus last week at 2857.5K. The moving average is the lowest level since March 21, 2020
- The largest increases in initial claims for the week ending September 4 were in Louisiana (+7,664), Michigan (+5,318), California (+1,209), Kansas (+528), and Nevada (+420),
- The largest decreases were in Missouri (-6,949), New York (-3,020), Florida (-2,482), Tennessee (-1,923), and Georgia (-1,814).