Chainlink (LINK/USD) Remains in the Bearish Zone, Despite Recent Surge

Chainlink (LINK/USD) has enjoyed a stellar rise since the last days of July, rising from a low of about 13.5 on July 22 to a high of slightly above 36 on September 6. However, LINK/USD is yet to recover from the bearish momentum that began on September 7.
It reached a low of 21 on September 22, after breaking below a support area around 25, which has now turned into resistance. Since then, LINK/USD has been making bullish turns.
At the time of writing, the crypto token was trading at 24.9, right below the support area. Any attempted break above the newfound resistance has been muted.
– A Technical Outlook
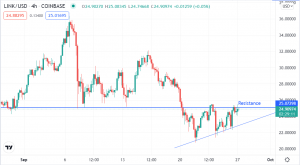
Chainlink 4-Hour Chart Analysis
Looking at the 4-hour chart above, we can see that LINK/USD is trapped below the resistance level. However, it shows some bullish signs that could see it break above for a new bullish momentum. The crypto token is already making higher lows from the September dip.
Currently, LINK/USD is on a short-term bullish trendline that, together with the resistance, forms an ascending triangle. Will LINK/USD break above the resistance to sustain the bullish momentum?
Chainlink New Partnership
On its website, Chainlink claims to support advanced smart contracts on any blockchain. On September 25, a new partnership between Chainlink and Cardano was announced. The partnership aims to enable developers to create smart contracts for Cardano’s DeFi applications.
The Cardano-Chainlink partnership is good news for Chainlink enthusiasts, who have been looking forward to the platform delivering on its promise. Since the news, LINK/USD has attempted to break higher, but the resistance has held it back.
With the improved sentiment, we could see LINK/USD trading higher, but we need to watch key breakouts before entering a buy trade.
LINK/USD Trade Idea
For now, I would stay on the sidelines until LINK/USD breaks sufficiently above the resistance at 25. I expect a break above the resistance followed by the formation of bullish trade signals to welcome a bullish momentum.
Besides this, I would also watch range trading on LINK/USD on the ascending triangle. LINK/USD could continue trading above the short-term trendline and below the resistance until new buyers come in to take it higher. I would consider a break above the ascending triangle to indicate a bullish move and enter buy trades accordingly.
If buy trades are confirmed on LINK/USD, targets could be placed at around 28, 29.5 and 31, which have acted as market event areas before. Happy trading!
- Check out our free forex signals
- Follow the top economic events on FX Leaders economic calendar
- Trade better, discover more Forex Trading Strategies
- Open a FREE Trading Account
- Read our latest reviews on: Avatrade, Exness, HFM and XM
Related Articles


Sidebar rates
Related Posts
