Shiba Inu Price Analysis: SHIB/USD Tossing in Triangle at $0.000027
The SHIB/USD coin failed to stop its early-day bearish rally and drew further offers around the $0.00002789 level. The declines may have app
Written by:
Arslan Butt
•
Tuesday, October 19, 2021
•
2 min read
•
Last updated: Tuesday, October 19, 2021
The SHIB/USD coin failed to stop its early-day bearish rally, drawing further offers around the $0.00002789 level. The declines may have appeared after the world’s largest cryptocurrency, Bitcoin, started to lose some ground. The Bitcoin price remained strong above the $60,000 zone, trading in a positive zone.
BTC jumped above the $62,000 level, before starting a downside correction. Meanwhile, the bearish bias on the broad-based US dollar has significantly limited further losses in major currencies. The greenback met with some fresh supply, amid a modest pullback in the US Treasury bond yields, following the previous day’s good two-way price moves.
A quick Shiba Inu price review
The SHIBA INU is trading near USD 0.00002795, with a 24-hour trading volume of $0.00002795. SHIBA INU has fallen by 0.82% in the last twenty-four hours. Its current market ranking is #19, with a live market cap of $11,054,149,906. There is a circulating supply of 394,796,000,000,000 SHIBA INU coins and the max. supply is not available.
In 2021, the Shiba Inu (SHIB) market is in a robust bull market, with one big continuation pattern on the more extended period charts, indicating the potential for another 90% rise.
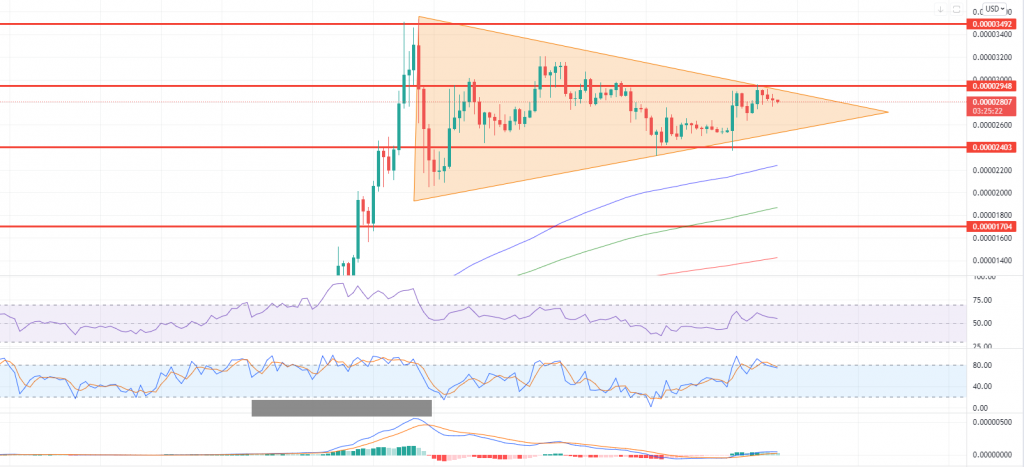
On October 8, SHIB increased by nearly 1,250 percent year to date (YTD), to $0.00003528 (data from Binance), setting a new yearly high. Later, profit-taking emotions caused the coin to crack, resulting in a price drop of 41.50 percent to $0.00002060. However, the bulls started accumulating SHIB near the said low level. Following a rebound, the price rose over 55% to $0.00003200, where it was met with another round of selloffs. In the following sessions, the SHIB price formed lower highs and higher lows, establishing a triangle structure that resembles a bull pennant.
Weakness in the US dollar underpins SHIB/USD
The emergence of new selling surrounding the US dollar halted the losses in the SHIBA INU prices. Following the previous day’s solid two-way price swings, the USD experienced more supply, following a slight decline in US Treasury bond yields. This was viewed as a significant factor in favor of the SHIB/USD pair.
Meanwhile, the decline in the dollar was aided significantly by negative US data that was previously released. Furthermore, the USD’s losses were exacerbated by rising speculation that monetary policy would normalize faster in other countries. At 93.727, the US Dollar Index, which measures the dollar’s value in relation to a basket of other currencies, was down 0.23 percent.

Shiba Inu Price Analysis: Symmetrical Triangle Support at $0.000028
The SHIB/USD has a slight bearish bias at the 0.000028 level, holding above an immediate support level of 0.000024. The closing of candles above the 0.000024 level is likely to trigger a bullish trend until the next resistance level of 0.00002948. At the same time, a breakout at 0.00002948 would expose the pair to levels of 0.000032 and 0.0000349.
At the moment, the support level continues to hold around 0.00002403. On the lower side, a breakout at the 0.00002403 level could lead the SHIB/USD price towards the 0.000020 level. The series of EMA data also supports a bullish trend in the SHIB/USD pair. Let’s consider staying bullish above 0.00002403 until the 0.00002948 level. Good luck!
Arslan Butt
Lead Markets Analyst – Multi-Asset (FX, Commodities, Crypto)
Arslan Butt serves as the Lead Commodities and Indices Analyst, bringing a wealth of expertise to the field. With an MBA in Behavioral Finance and active progress towards a Ph.D., Arslan possesses a deep understanding of market dynamics.
His professional journey includes a significant role as a senior analyst at a leading brokerage firm, complementing his extensive experience as a market analyst and day trader. Adept in educating others, Arslan has a commendable track record as an instructor and public speaker.
His incisive analyses, particularly within the realms of cryptocurrency and forex markets, are showcased across esteemed financial publications such as ForexCrunch, InsideBitcoins, and EconomyWatch, solidifying his reputation in the financial community.
Related Articles