Gold Price Analysis – Why Could XAU/USD Short Under $1,857?
The gold price is in a corrective phase following a ferocious rally to a high of $1,857.64 in the early Asian session. The precious metal
The gold price is in a corrective phase following a ferocious rally to a high of $1,857.64 in the early Asian session. The precious metal rose perpendicularly on Thursday after falling to a low of $1,815.66 as yields fell. It is worth noting that the risk-aversion theme has supported GOLD prices and other currencies this time, but the US dollar index (DXY) and global equities are in turmoil.
Investors are skeptical that the Federal Reserve (Fed) will avert a recession, which has reduced the DXY’s appeal. As a result, expectations of lower profits due to downturn fears have resulted in an extreme sell-off in global equities.
The 10-year US Treasury yield has fallen by 3.32 percent to near 3.19 percent, and the current price action suggests further declines. Vulnerable yields will further weaken the DXY. After falling below Thursday’s low of 103.42, the DXY is already trying to balance below 104.00 and is expected to extend its two-day losing streak.
The main event in today’s session will be Fed Chair Jerome Powell’s speech. Investors will understand the Fed’s ideology behind a 75 basis point (bps) rise in interest rates announcement. Through this, guidance for July’s monetary policy will be critical.
Gold (XAU/USD) Technical Outlook
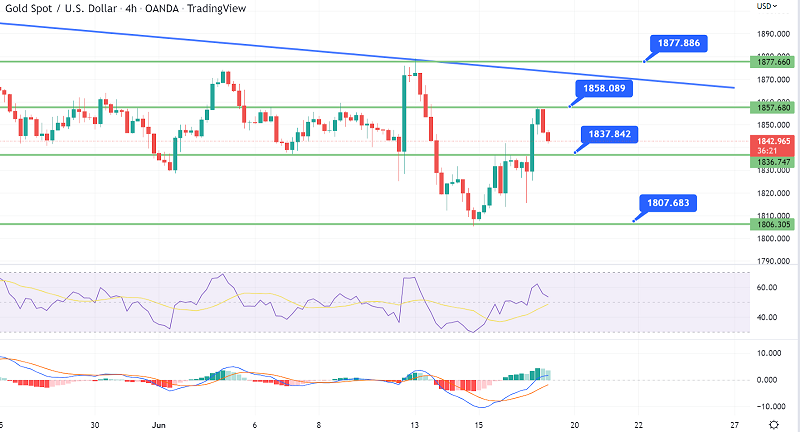
The gold price remains stable below the 1858.10 level, and the EMA50 continues to press negatively on the price, keeping the bearish trend scenario active today.
On an hourly basis, gold prices are approaching the critical resistance level of $1,857.73. However, a minor pullback typically accompanies a significant upward move. The precious metal is expected to correct slightly towards the 21-period Exponential Moving Average (EMA) of $1,842.35.
In the meantime, the Relative Strength Index (RSI) (14) has moved into a bullish range of 60.00-80.00, supporting the bullish momentum. A minor correction could push the RSI (14) below 60.00, but the bullish momentum will continue.
Today’s trading range is expected between 1825 support and 1858 resistance.
- Check out our free forex signals
- Follow the top economic events on FX Leaders economic calendar
- Trade better, discover more Forex Trading Strategies
- Open a FREE Trading Account


