Ethereum Breaks $1100 Trendline Support – Brace for Further Downtrend
Ethereum has experienced multiple rejections at $1,280 in recent weeks. Its goal remains to rise above the aforementioned price level.
Ethereum has experienced multiple rejections at $1,280 in recent weeks. Its goal remains to rise above the aforementioned price level. Since July 8, ETH has been trading in a downward channel. ETHEREUM has lost 3.3 percent in the last 24 hours, effectively reversing its weekly gain.
On a short time scale, the technical outlook remains bearish. The multiple pullbacks that Ethereum has experienced could potentially catapult the price higher. In that case, ETH may aim for resistance levels above $1280.
The coin’s two other significant barriers were $1420 and $1540. Broader market strength may aid Ethereum’s resurgence; BITCOIN, too, has been struggling at the $20,000 price level. As a result, most altcoins have followed the same price movement. When Bitcoin’s chart shows signs of recovery, buying strength will increase. Sellers continue to dominate Ethereum at the moment.
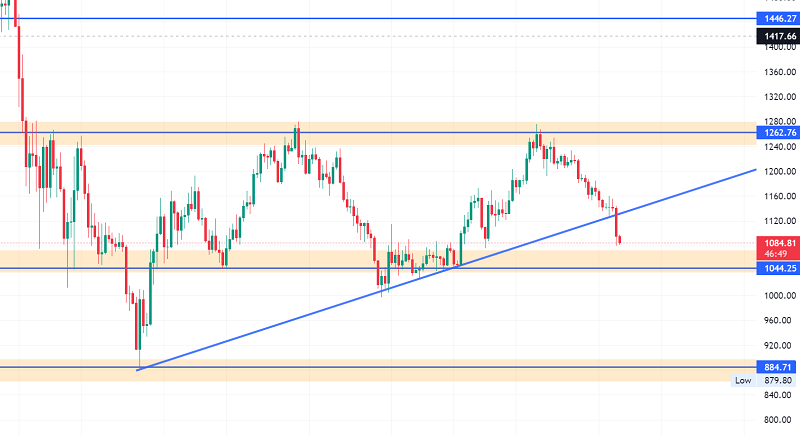
At the time of writing, ETH was worth $1,140. It broke through its $1,170 support level and moved closer to its critical price floor of $1,000. At the $1,280 level, the coin experienced three price pullbacks. Another pullback could push ETH above the $1,280 level. Following $1,280, the barriers were $1,440 and $1,540, respectively.
If ETH fails to maintain its price above $1,140, it could fall to $900. However, given the market conditions, the possibility of the same cannot be ruled out. The volume of Ethereum traded has decreased significantly, indicating that buying pressure has decreased due to bearish pressure.
Ethereum (ETH/USD) Technical Outlook
ETH has recently seen a significant drop in buying strength, and the Relative Strength Index painted a similar picture. The RSI fell and was seen below the half-line. A reading below the half-line indicates increased market selling pressure.
The price of ETH was below the 20-SMA line, indicating that the asset had been sold. Sellers were responsible for driving the market’s price momentum. The buying pressure on ETH has remained low, as evidenced by the four-hour chart. Moving Average Convergence Divergence indicates price momentum and its reversal. MACD displayed red histograms after a bearish crossover.
Red histograms indicate a sell signal. This explains the recent drop in the price of Ethereum. Bollinger Bands depict the asset’s price volatility. Bollinger Bands have slightly widened, indicating that the asset’s price is expected to fluctuate.
In the event of further decline, ETH is aiming for $1,000; on the other hand, the digital currency may be able to break through the $1,280 resistance line. Good luck!
- Check out our free forex signals
- Follow the top economic events on FX Leaders economic calendar
- Trade better, discover more Forex Trading Strategies
- Open a FREE Trading Account
- Read our latest reviews on: Avatrade, Exness, HFM and XM
Related Articles


Sidebar rates
Related Posts
