Remaining Short on EUR/GBP After the Rejection by MAs
Yesterday we saw a sudden risk reversal after the US ISM non-manufacturing report, which showed that the services sector expanded in November at a decent pace. As a result, the sentiment turned negative and risk assets turned bearish, making some considerable losses after two weeks of gains.
US WTI crude Oil traded as high as $82.72 yesterday as the G7 price cap on Russian Oil kicked in and markets digested the OPEC decision. However the gains didn’t last as the risk mood sours and WTI fell down to $76.70s, which means more than $2 on the day. One reason may be Libya signaling more production.
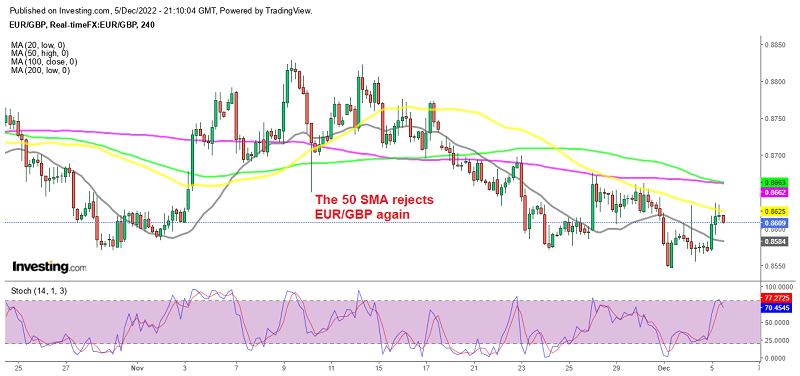
EUR/USD and GBP/USD both fell more than 100 pips yesterday after the reversal, although EUR/GBP was still pushing up, increasing from 0.8570 to 0.8635, piercing the 50 SMA (yellow) on the H4 chart, which has been acting as resistance since the middle of November.
We opened a sell EUR/GBP signal lower with a stop loss above the 50 SMA, which was triggered as buyers pushed the price above this moving average. But, the price returned back below it and we opened another sell forex signal in this pair, which proved to be a good decision as the decline continued.


