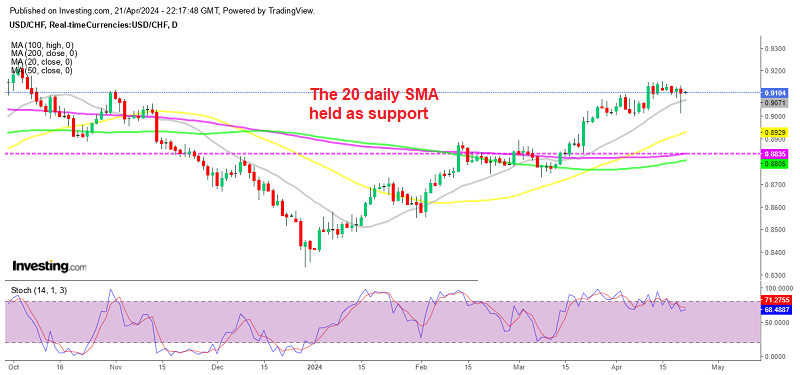
Major Test Above 0.91 for USD/CHF – Can the Trend Change?
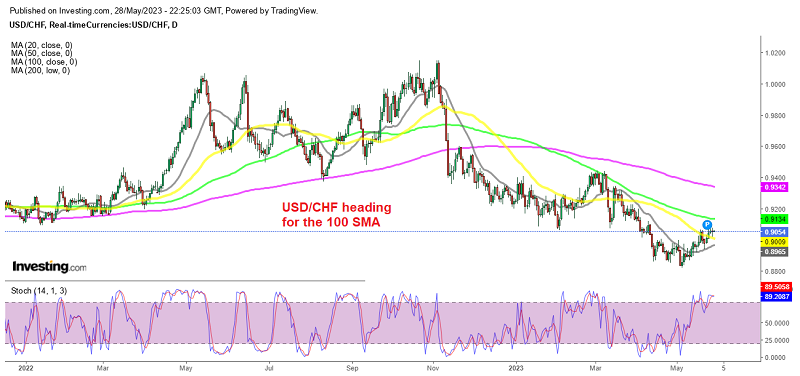
USD/CHF used to be bearish since its highs in October last year. We noted that any upward bounces were short lived, with the expectation of further downward movement. We suggested that these bounces should fail to develop into extended upward swings, limited to 3, 7, or 11 swings, indicating a continuation of the downward trend.
We did see a retrace during Q1, as the USD recuperated somewhat, but the retrace ended at the 100 SM A(green0 on the daily chart above. This provided an opportunity for sellers to add further on short positions. Eventually, the decline resumed and USD/CHF fell to 0.88 lows.
This was the lowest level since January 2021. After finding support at the bottom, this pair initiated a rally towards the 0.90 resistance. This upward movement was triggered by several US economic indicators in the last two weeks which were positive and exceeded expectations, pushing the market to reassess its outlook on future interest rate odds by the FED.
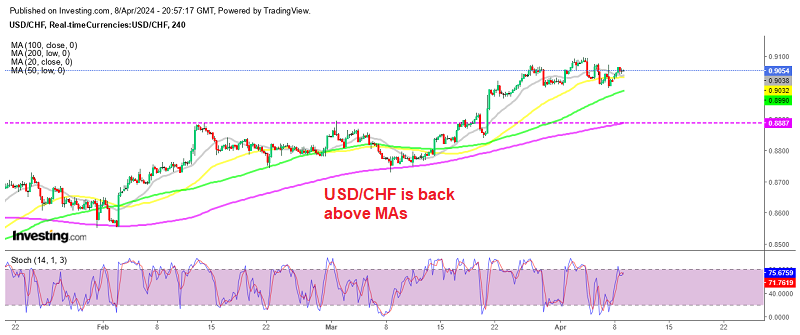
USD/CHF H4 Chart – The 50 SMA Has Turned Into Support

Dips keep getting bought
Initially, the market reacted bearishly to the Federal Reserve’s indication of a pause in June. But, the FED also left room for the possibility of another rate hike if the data remained strong. Subsequently, US economic data, including robust NFP figures, a significant increase in long-term consumer inflation expectations, better-than-expected retail sales, favorable jobless claims, and strong Services Purchasing Managers’ Index (PMI), exceeded forecasts.
These positive data points may contribute to higher core inflation for a prolonged period and potentially necessitate further action by the FFED. As a result, USD/CHF is now approaching a breakout of a trendline and the key psychological level of 0.90. Additionally, the moving averages have crossed to the upside, indicating a potential bullish momentum. If conditions remain unchanged, there is a possibility of USD/CHF reaching the 0.91 level in the near future.


