EUR/JPY could retest 158 rejection if it sustains 152 interim support
The EUR/JPY is gradually overcoming the exponential moving average (EMA) at 155.5, after facing resistance at 158 in the 4-hour chart. The main support is slightly below the current price of 154, at the displaced moving average (DMA) at 152.
The EUR/JPY currency pair is currently experiencing a gradual upward movement, as it overcomes the exponential moving average (EMA) at 155.5. However, it encountered resistance at the 158 level in the 4-hour chart. At present, the main support level is slightly below the current price, indicated by the displaced moving average (DMA) at 152.
Let’s analyze the technical indicators to understand the market sentiment and potential EUR/JPY trading opportunities
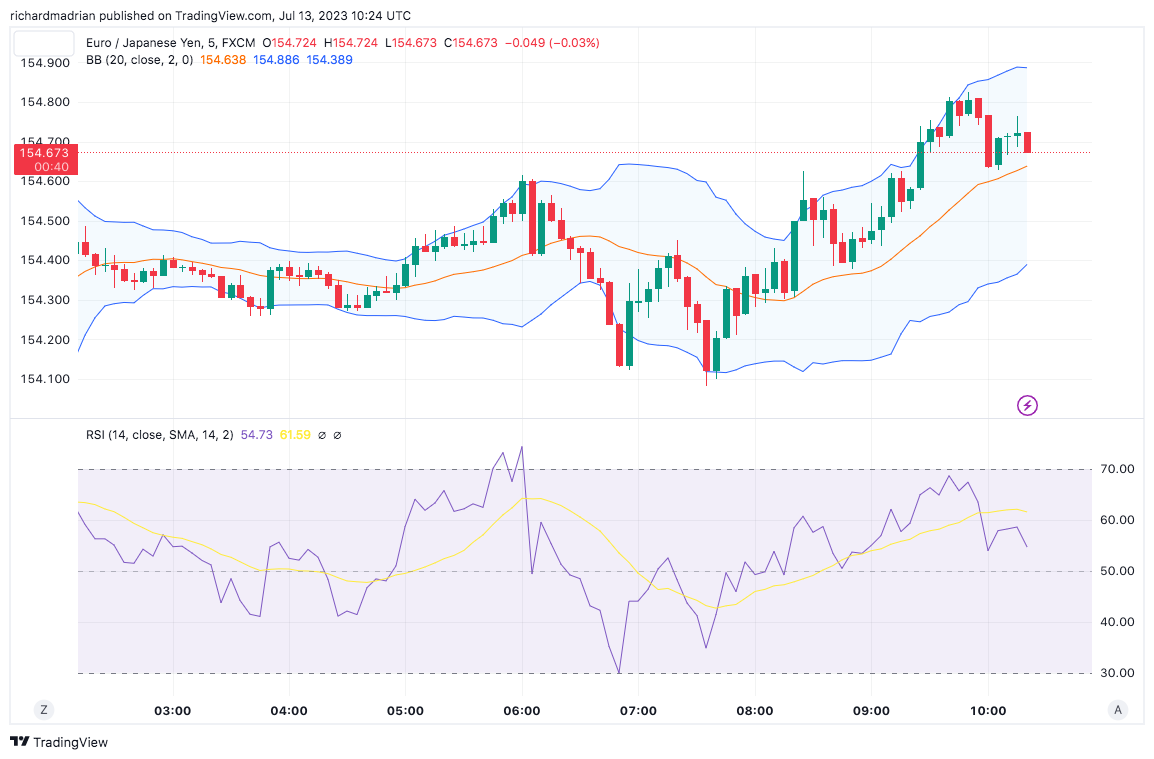
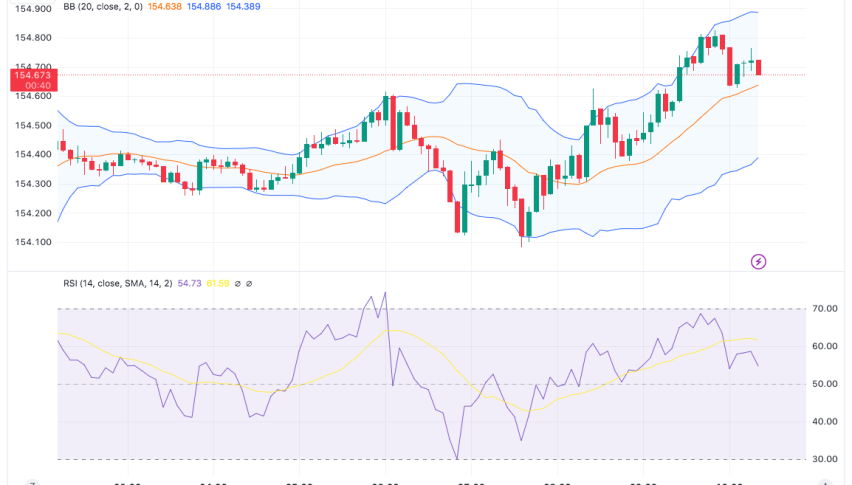
The Relative Strength Index (RSI) is at 51. With a value around the neutral zone of 50, the RSI suggests a balanced sentiment between buyers and sellers. This indicates that there is no strong bias towards either side. Traders should closely monitor any RSI movements towards the overbought or oversold levels for potential signals of a shift in momentum.
The 14-day Stochastic oscillator is at 15.7. The low value of the Stochastic oscillator suggests that the currency pair is currently oversold. This indicates that selling pressure has dominated the market recently.
Traders should exercise caution and be prepared for potential reversal signals, as the oversold condition could lead to a price correction or a trend reversal.
The Bull Bear Power indicator is negative, with a value of -2.308. This indicates that bears are currently in control of the market. However, it is important to note that the negative value is relatively small, suggesting that the bearish pressure may not be significant.
Traders should monitor for any changes in the Bull Bear Power indicator, as a shift towards positive values could indicate a shift in market sentiment.
The Awesome Oscillator stands at 1.461. The positive value suggests that there is some bullish momentum in the market.
However, the value is not particularly strong, indicating that the bullish pressure may be relatively weak. Traders should closely monitor the movements of the Awesome Oscillator for potential changes in momentum and to identify potential trading opportunities.
In summary, the EUR/JPY currency pair is gradually overcoming the resistance at 158 and is currently supported by the EMA at 155.5. The technical indicators provide a mixed picture, with the MACD suggesting bullish momentum, the RSI indicating a balanced sentiment, the Stochastic oscillator suggesting an oversold condition, the Bull Bear Power indicating bearish pressure, and the Awesome Oscillator suggesting some bullish momentum. Traders should carefully consider these factors and implement appropriate risk management strategies. Potential trading opportunities could arise from monitoring key support and resistance levels, as well as looking for potential reversal signals based on the Stochastic oscillator and Bull Bear Power indicator.
- Check out our free forex signals
- Follow the top economic events on FX Leaders economic calendar
- Trade better, discover more Forex Trading Strategies
- Open a FREE Trading Account
- Read our latest reviews on: Avatrade, Exness, HFM and XM
Related Articles


Sidebar rates
Related Posts
